Eclipse Web Tools Platform 3.2 - New and Noteworthy | Back |
General
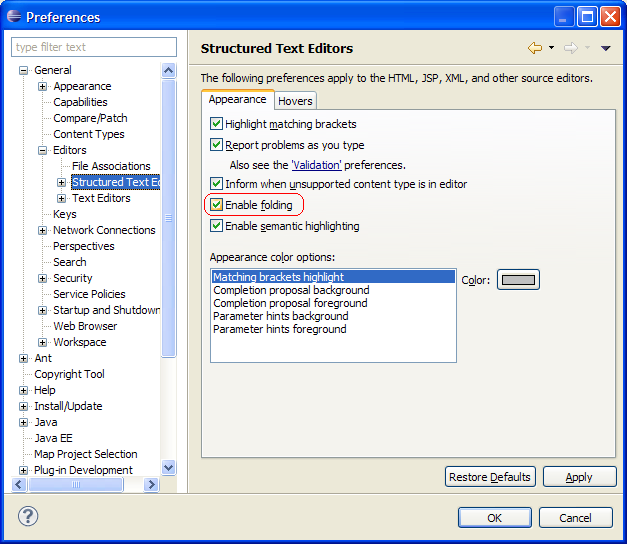
Code Folding enabled by default
Code folding is now enabled by default. The CSS, HTML, JSP and XML
editors all support code folding, as well as the JavaScript editor.
As before, folding when editing CSS, HTML, JSP and XML languages is controlled from
the
Structured Text Editors
preference page.
Character Pairing
SSE-based editors now support automatic character pairing while typing. The power is in the hands of the adopters, since no pairs are explicitly defined by default.
XML
Fix XML Declaration
Cleaning up an XML document now includes correcting missing or misplaced XML declarations. For documents that are missing an XML declaration, one will be added using the default encoding set on the XML Files preference page. If the existing XML declaration is not at the start of the document, it will be moved to the start of the document.
This option can be toggled in the Cleanup dialog when executing the Cleanup Document... action of the Source menu.

More Typing Preferences
New typing preferences have been added to automatically close attribute values, parentheses and square brackets.

XML Comment Formatting
Formatting comments in the XML editor now adheres to two new preferences. The Format comments preference allows users to disable comment formatting entirely. The Join lines preference allows for comments to have their lines joined when a particular line's text does not exceed the maximum line width.
These preferences can be accessed via the XML Editor's preference page.

Full XML Catalog Preferences
- Rewrite entries (where a starting prefix is exchanged for another)
- Suffix matching
- Delegate catalogs (i.e. catalogs included if the URI being sought after matches a given prefix)

The XML Catalog page now supports creating all kinds of XML catalog elements, notably:
Thanks to Holger Voormann for the icons!
Quick Outline
The XML editor provides a Quick Outline that has a filterable set of elements. Selecting an element from the quick outline will highlight the corresponding element in the source editor.

Paged Content Assist Cycling
Content assist in the XML editor now has multiple pages. This new functionality creates an identical user experience to that of Java editors. The default, or first page, of content assist still displays the same results, by default, as the old content assist did but subsequent invocations of content assist will display different pages of content assist suggestions.

The order in which results are displayed on the default content assist page and the order in which subsequent pages are displayed are user configurable through a new preference page.

Comment Folding
XML comments can now be folded in the editor. When a comment is folded, the first line of text remains visible.

After folding the comment...

As always, the appearance of commented text can be adjusted using the XML Syntax Coloring preference page.
HTML
Quick Outline
The HTML editor provides a Quick Outline that has a filterable set of elements. Selecting an element from the quick outline will highlight the corresponding element in the source editor.

Paged Content Assist Cycling
Content assist in the HTML editor now has multiple pages. This new functionality creates an identical user experience to that of Java editors. The default, or first page, of content assist still displays the same results, by default, as the old content assist did but subsequent invocations of content assist will display different pages of content assist suggestions.

The order in which results are displayed on the default content assist page and the order in which subsequent pages are displayed are user configurable through a new preference page.

More Typing Preferences
New typing preferences have been added to automatically close attribute values, parentheses and square brackets.

XSL
PsychoPath XPath 2.0 Processor
The PsychoPath XPath 2.0 Processor now passes all of the XPath 2.0 Core Test Suite. The processor is now 99.8 percent complaint to the entire XPath 2.0 Schema Aware portion of the W3C Test Suite. The processor framework may be used either as an OSGI bundle or as a standalone jar with out an OSGI container.
All development history and related bugs can be viewed on bug 262765.
Stylesheet Outline
The existing XML Outline View has been made XSL aware.

If the XSL feature has been installed the, XML Outline will now render an XSL aware view. This helps distinguish the existing XML elements from the XSL specific elements.
Stylesheet Model
A new view has been made available for XSL editing.
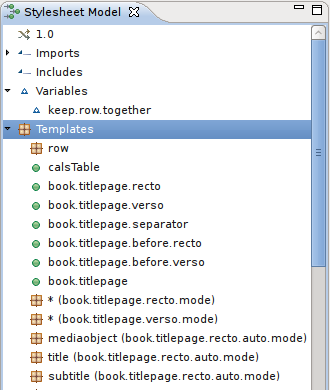
The view provides a quick and easy overview of the Templates, Import/Included stylesheets, and variables. Named Templates and Match Templates are grouped together and all elements. The view is linked to the active XSL Editor and the view can also be used to navigate the stylesheet.
XPath View - XPath 2.0 Support
The XPath View now has the ability to select between XPath 1.0 and XPath 2.0 as the language to be used during evaluation of the expression. The XPath View for XPath 1.0 uses Xalan's XPath engine for evaluation. For XPath 2.0, the PsychoPath XPath 2.0 processor is used.'

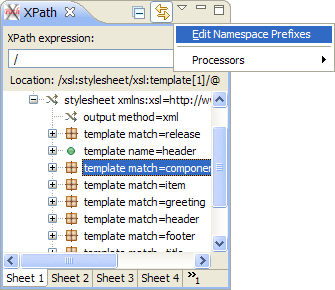
XPath View - Edit Namespaces
The XPath view now supports editing the namespace prefixes to be used during the evaluation of the expression. This provides the ability to assign xpath expressions to the default namespace as well as specify specific prefixes for various namespaces in an XML document used during the evaluation.
XPath 2.0 element and attribute Schema Awareness
The PsychoPath XPath 2.0 processor now supports the schema aware features of the ElementTest and AttributeTest during instance of evaluation.
JSDT
Perspective changes
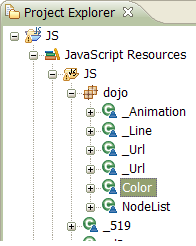
The JavaScript-specific Script Explorer view has been removed and its functionality integrated into the Project Explorer (or corresponding views in adopter products, see bug 311459 for details). The JavaScript objects defined in Source folders now appear under the familiar JavaScript Resources node, just as the contents of Libraries have in earlier releases. Additionally, JavaScript source files found in the project's Include Path are now themselves expandable.

Improved namespace support
When working with larger codebases, it's common to declare objects in a way that mimics Java's packages:

The JavaScript Resources node now offers the ability to group contents into their namespaces, mimicing the corresponding layout offered for Java classes.

This option is enabled by default, but can be toggled using the Folder Presentation submenu.

JSDI API
-
org.eclipse.wst.jsdt.debug.core.jsdi- which contains the core JSDI descriptions for debug elements and JavaScript values -
org.eclipse.wst.jsdt.debug.core.jsdi.connect- which contains descriptions of debug client connectors that are used to plug into the core launching framework -
org.eclipse.wst.jsdt.debug.core.jsdi.event- which contains descriptions of all of the events JSDI handles while debugging -
org.eclipse.wst.jsdt.debug.core.jsdi.request- which contains descriptions of all of the kinds of requests that can be sent using JSDI
The JavaScript Debug Interface (JSDI) is an API that consumers can implement to hook into the use of the debug core and UI bundles. Implementing SDI for a particular scenario allows consumers to take advantage of the debug model and UI for free
JSDI is provided as new API in the
/org.eclipse.wst.jsdt.debug.core
bundle in the packages:
Rhino Debug Support
- A Rhino connector
- A Rhino debug client to enable remote debugging
- Source lookup
- Breakpoint participants
- The Rhino console
JSDT Debug provides a base implementation of JSDI in the form of Rhino debug support. This support includes:
Quick Access to Breakpoint Properties
Breakpoint properties are now quickly accessible via the context menu in the Breakpoints View (to better match JDT breakpoint support).
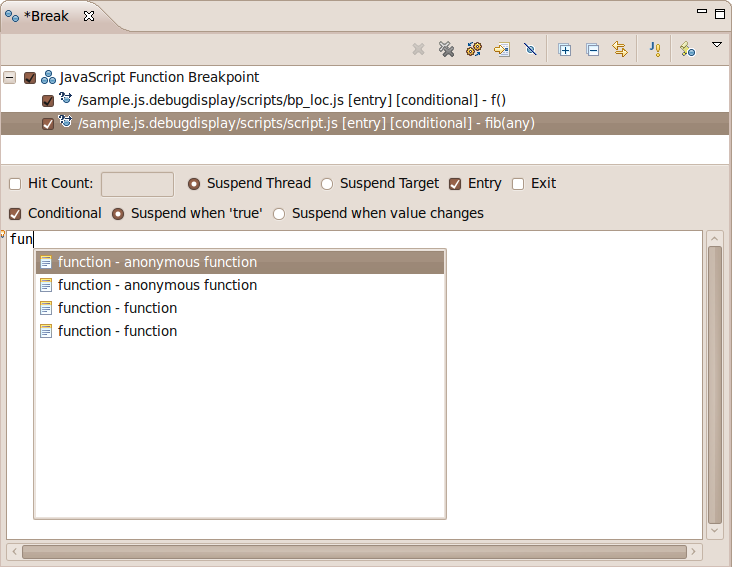
Breakpoint Condition Content Assist
Content Assist is now available in the breakpoint condition editor.
Rhino Console
When wanting to test Rhino, or work from a command line interface,
we have provided the Rhino debug console.
Our Rhino console allows
access to all of the Mozilla Rhino shell tools as described
here
. Our shell replacement can be run using the
org.eclipse.wst.jsdt.debug.rhino.debugger.shell.DebugShell
class from the
org.eclipse.wst.jsdt.debug.rhino.debugger
project.

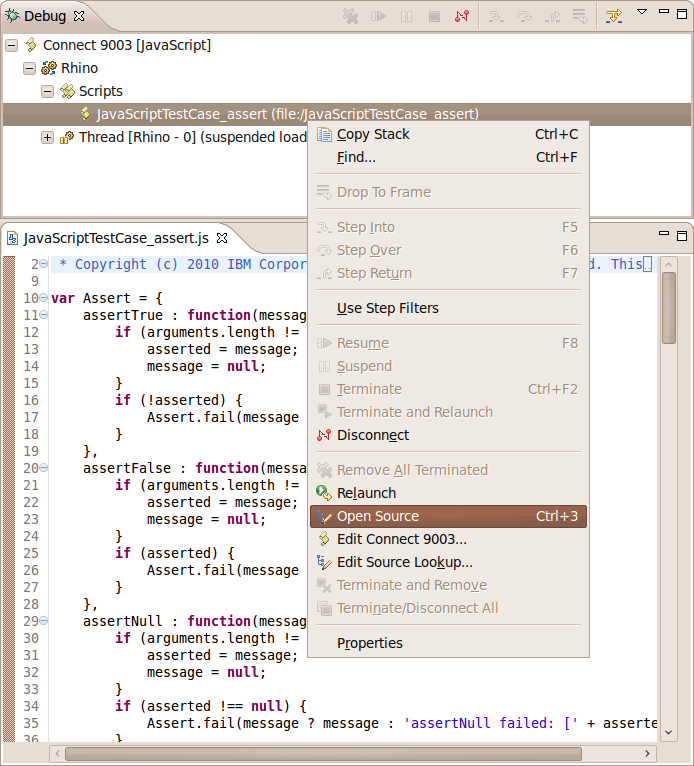
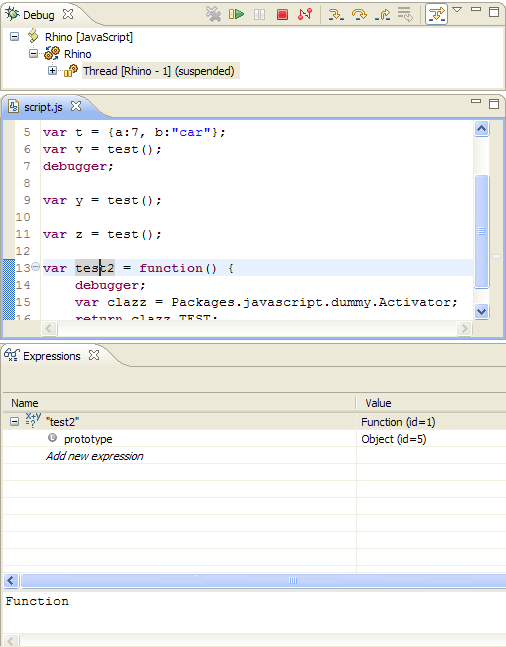
Show All Scripts
In the Debug View you can view all of the scripts currently loaded in the the running debug target.

Open Source (Ctrl+3)
When showing all scripts you can also load the source for any scripts that has been loaded at any given time. To do so we have provided the Open Source command available in the Debug View (Ctrl + 3).
Step Into Script Load
With our existing support to suspend execution when a (or any) script loads it was not clear to the user what could happen next. We have added support to be able to step into the first executable line of the the loaded script (as well as resume execution like before). Also the suspended message on the thread now gives a very clear message why you are suspended.

Breakpoint Participants
Breakpoint participants can be contributed by consumers to take part in the suspension of any of the supported
breakpoint types (function, line or script load). They can be provided via the org.eclipse.wst.jsdt.debug.core.breakpointParticipants
extension point.
Rhino provides an implementation that participates in the suspension of all breakpoint types:
	<extension point="org.eclipse.wst.jsdt.debug.core.breakpointParticipants">
	  <participant
	     class="org.eclipse.wst.jsdt.debug.internal.rhino.breakpoints.RhinoBreakpointParticipant"
	     kind="*">
	  </participant>
	</extension>
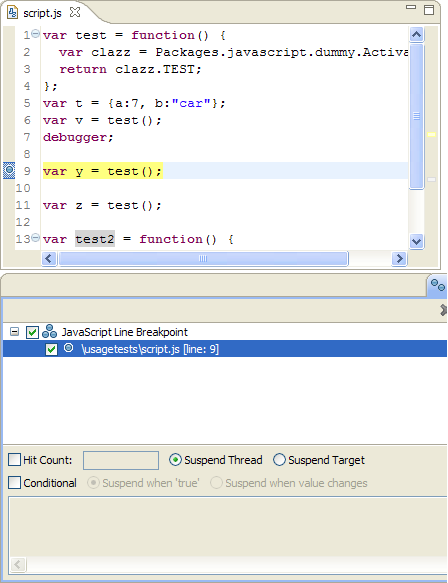
Line Breakpoints
Like any other, the JavaScript debugger provides line breakpoints. These can be set using the standard methods such as toggling in the editor ruler, from the Outline View or using Ctrl+Shift+B when in source.
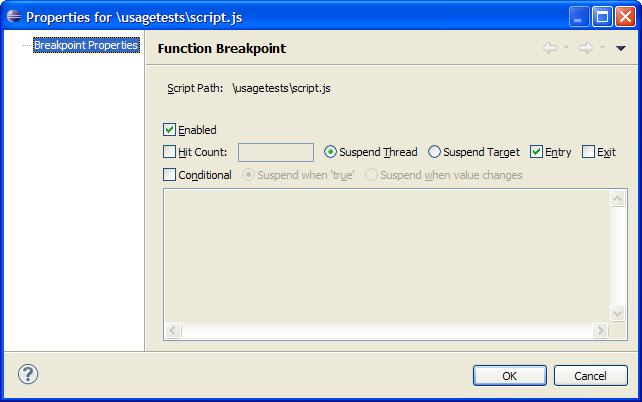
Function Breakpoints
Function breakpoints are supported similarly to JDT, allowing a suspend on entry or exit from a function. These can be set using the standard methods such as toggling in the editor ruler, from the Outline View or using Ctrl+Shift+B when in source.

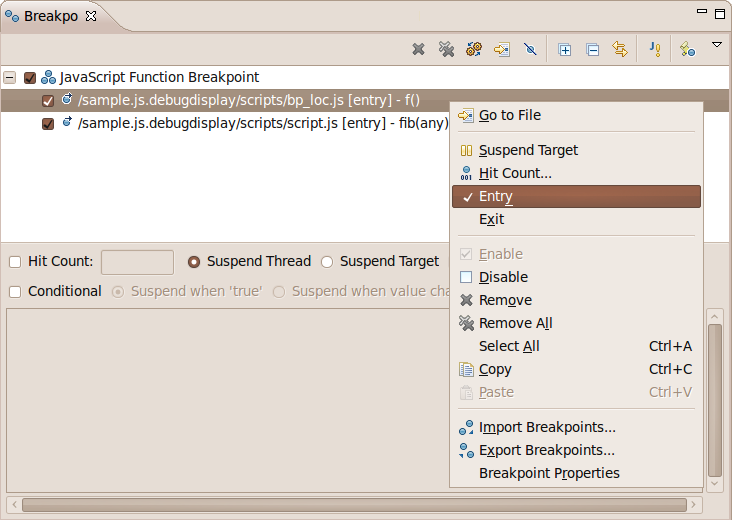
Script Load Breakpoints
Script load breakpoints can be set per JavaScript to suspend execution when that particular script is loaded. This feature provided by a toolbar action in the Breakpoints View.
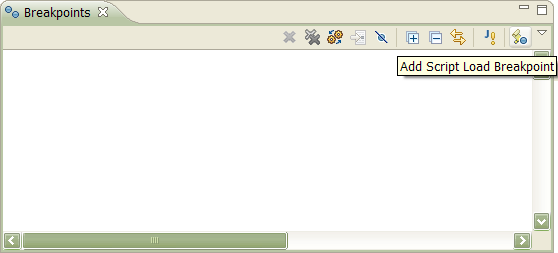
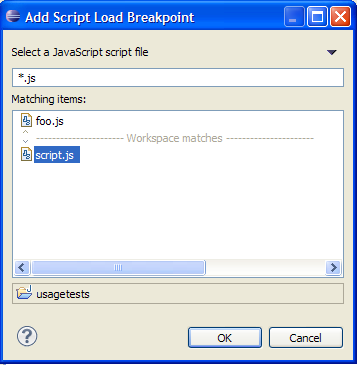
Example of a script load breakpoint
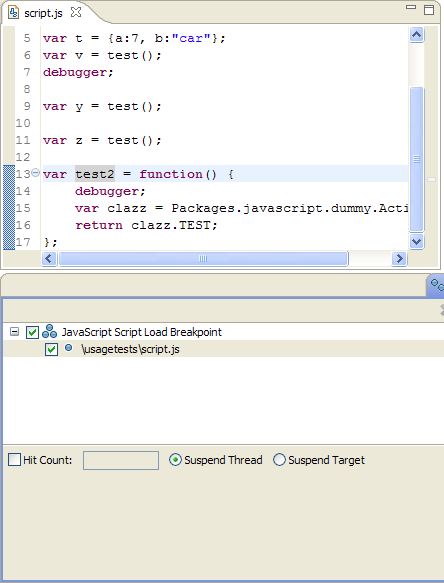
Breakpoint Detail Panes
For each of the breakpoint types we support there are accompanying details panes for the new Breakpoints View. Each detail pane allows you to quickly make changes to that kind of breakpoint.

Breakpoint Properties
Each breakpoint type has its own properties page that is opened via the Breakpoint View using the standard Alt+Enter key binding or the context menu.
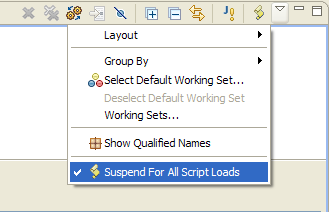
Suspend when any script loads
- An evaluated script loads and you want to be able to step through it during the evaluation
- You are trying to find our what scripts are loaded in what order
- You are trying to find a particular script and don't know its name or have it in your workspace
Even with support to suspend when a particular script loads, it is extremely useful to be able to know when any given script loads. This is particularly useful for know when:
Universal Launching Support
To support remote debugging we support a reusable UI that consumers get for free when they provide a JSDI launching connector.
The following example is the UI for Rhino launching connector.

Watch Expressions
Watch expressions can be added to a debug session in the same manner as JDT. They are re-evaluated after stepping operations and are persisted across workbench invocations.
JSP
Quick Outline
The JSP editor provides a Quick Outline that has a filterable set of elements. Selecting an element from the quick outline will highlight the corresponding element in the source editor.

Paged Content Assist Cycling
Content assist in the JSP editor now has multiple pages. This new functionality creates an identical user experience to that of Java editors. The default, or first page, of content assist still displays the same results, by default, as the old content assist did but subsequent invocations of content assist will display different pages of content assist suggestions.

The order in which results are displayed on the default content assist page and the order in which subsequent pages are displayed are user configurable through a new preference page.

More Typing Preferences
New typing preferences have been added to automatically close Java strings, parentheses and both square and angle brackets.

CSS
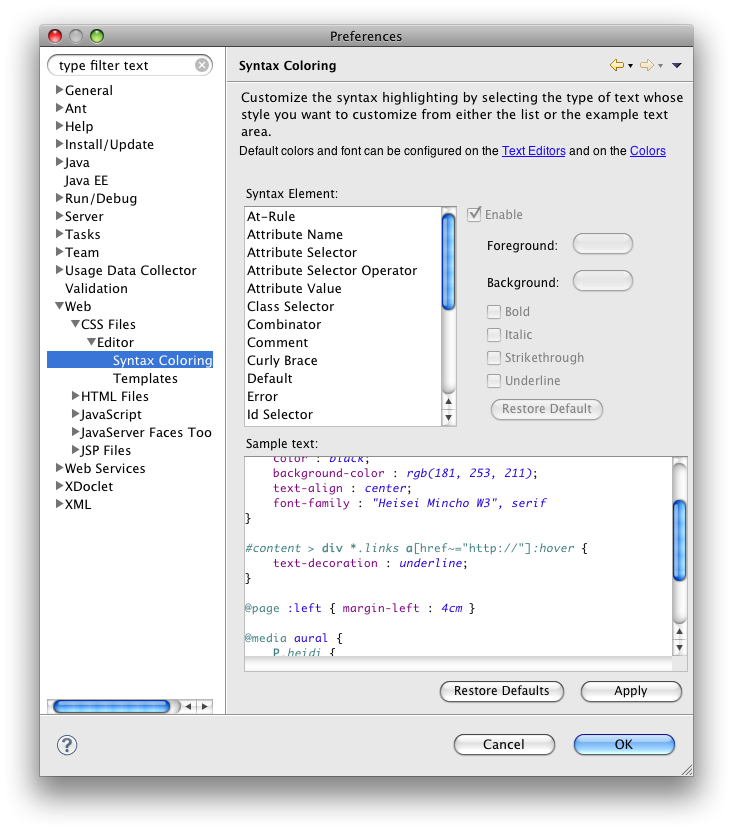
CSS Selector Syntax Highlighting Preferences
The CSS editor now has more syntax highlighting preferences for selectors. The syntax highlighting preferences are available from the Syntax Coloring Preference page.
CSS Comment Toggles
CSS files can now be quickly commented using the commenting actions common to other Structured Text Editors. The commenting actions are available from the Source menu.
Quick Outline
The CSS editor provides a Quick Outline that has a filterable set of elements. Selecting an element from the quick outline will highlight the corresponding element in the source editor.
