Java development tools
Java™ 18 Support |
|
| Java 18 |
Java 18 is out and Eclipse JDT supports Java 18 in 4.23 via
Marketplace.
The release notably includes the following Java 18 features:
Please note that preview option should be on for preview language features. For an informal introduction of the support, please refer to Java 18 Examples wiki. |
Java Editor |
|
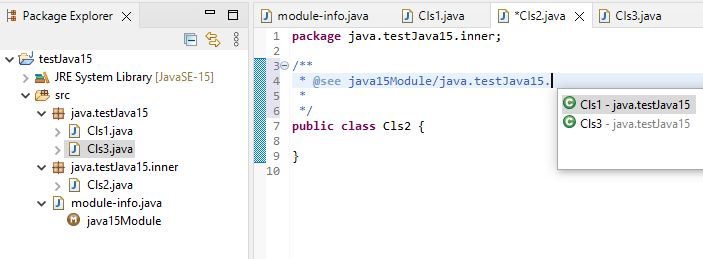
| Code assist support for module in @see, @link and @linkplain javadoc tags |
New code assist support has been added for modules in @see, @link and @linkplain javadoc tags for projects with Java level 15 or higher.
In the below image: When 'Ctrl + Space' is pressed at the cursor location, the module names that this project has access to are suggested.
In the below image: When 'Ctrl + Space' is pressed at the cursor location, the packages that the above selected module exports are shown.
In the below image: When 'Ctrl + Space' is pressed at the cursor location, the classes in the above selected package are shown.
|
| Save to static favorites |
A new quick assist has been added to save a static import to the Preferences > Java > Editor > Content Assist > Favorites list of static members to propose via content assist.
To invoke the new feature, perform a Ctrl + 1 on the desired static import to add:
|
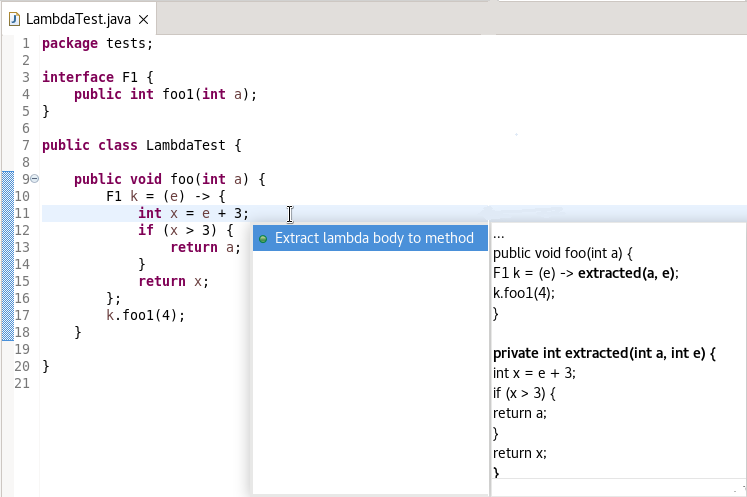
| Extract lambda body to method |
A new quick assist has been added to extract the body of a lambda to a method.
To invoke the new feature, perform a Ctrl + 1 within the selected lambda body:
|
Java Views and Dialogs |
|
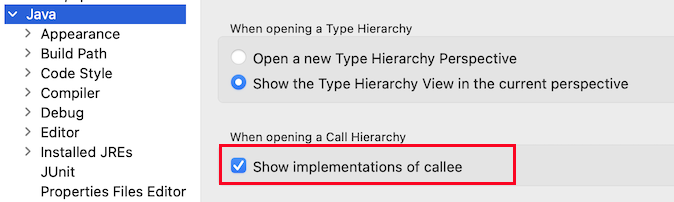
| Show implementations of callee |
The Call Hierarchy view can now show implementing methods as potential callee methods when viewing callees.
|
Java Formatter |
|
| New options for switch/case constructs |
A few new settings have been implemented in the Java Formatter that allow more control over switch constructs introduced in Java 14.
In the Line Wrapping section, we can decide to allow wrapping in switch cases: before or after an arrow, and also inside lists of expressions to match (this can be controlled separately for switch expressions and switch statements).
In the Keep braced code on one line section there are two new options for a more compact formatting of code blocks in switch cases with arrows or even whole switch expressions/statements.
The formatter configuration sections can be found in the Profile Editor (Preferences > Java > Code Style > Formatter > Edit...). |
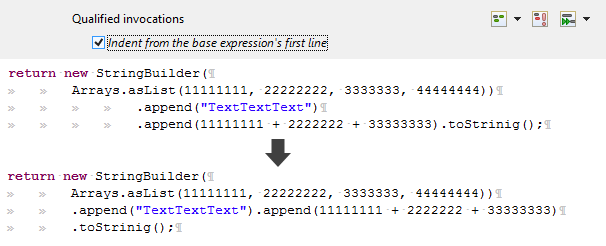
| Method invocation wrapping indentation |
It turns out that it's not obvious how to indent a wrapped method invocation when the preceding expression itself is complex enough to also be wrapped into multiple lines.
Should the indentation be added to the existing indentation at the end of the expression, or just reset and assume that only the indentation of expression's first line matters?
Previously only the former behavior was available, now there's a setting to choose the latter. The checkbox called Indent from the base expression's first line is located in the Line Wrapping > Wrapping settings > Function calls section, right under the Qualified invocations setting.
|
Debug |
|
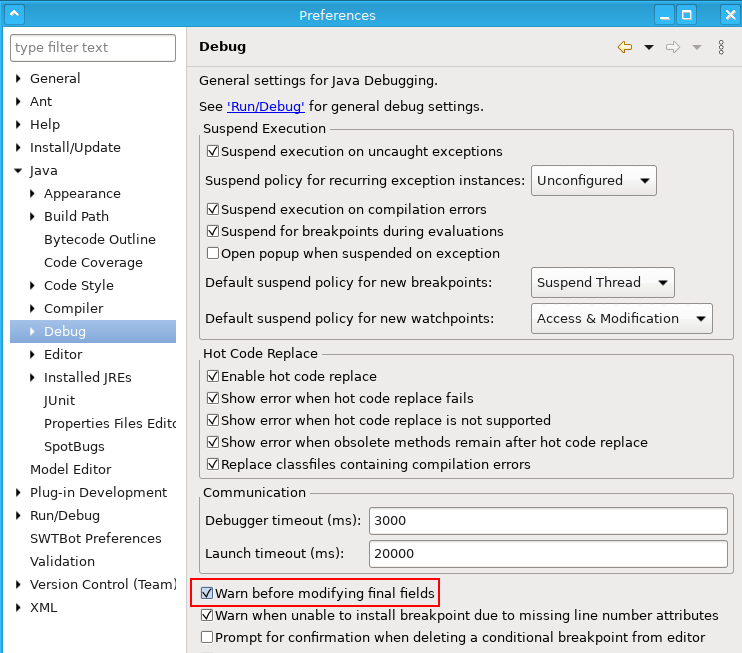
| Warning about changing final fields |
Since Eclipse 3.1 Eclipse Java debugger allows changes on final field values.
While technically possible, the consequences of such changes are not trivial,
could affect seemingly unrelated code and lead to various dangerous effects.
Therefore, with Eclipse 4.23 Java debugger shows a new warning:
This warning is enabled by default and can be disabled via preferences:
Additionally, |
| Highlight labelled objects in the "Expressions" view too |
Since Eclipse 4.22, the Java debugger allows to label object instances with custom strings.
This feature has been extended to show those labels in the Expressions view, highlighted with red color by default.
This works for watched and inspected objects too. |
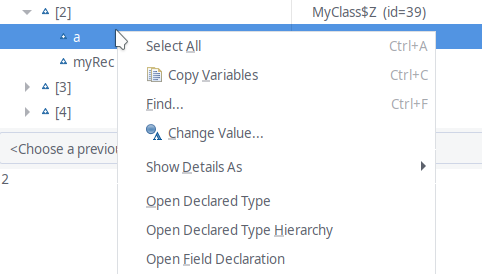
| Open field declaration |
During debugging, for a variable, previously it was only possible to navigate to the actual or to the declared type of that variable.
With the new Open Field Declaration context menu item, it is extended to go to the declaration of that field. This can be especially helpful,
if the object is inside a deep class inheritance hierarchy.
|
| Lambda Entry Breakpoint |
During debugging, you can now add entry breakpoints for Lambda expressions which will enable the debugger to stop at the entry of lambda expression instead of stopping at the first expression of the line.
You can see the breakpoint in the Breakpoints view indicated by the implemented functional interface. Double clicking the breakpoint in Breakpoints view will display the associated Lambda Expression in the editor.
You can add new Lambda Entry breakpoint by selecting the Toggle Lambda Entry Breakpoint from the Ruler context menu or Run menu. You can select a particular lambda expression to add the breakpoint, if none is selected the entry breakpoint is added to the first lambda expression on the line. You can add only one breakpoint per line.
|