ATL Use Case - Models Measurement

This use case shows how to compute and generate measures on terminal models using ATL 2.0RC2. The measures can be processed on KM3 metamodels or UML models. And the measurement data can be represented with HTML, SVG or XHTML. This work has been done in collaboration between SODIUS and the ATLAS Group.
As a complementary application to this contribution, an online service is provided at SODIUS's web site under the name "MC-Meter". The application offers you to freely measure your models and get an interactive report on them, using the Open Source contribution. The input models can be KM3 meta-models or UML models (in version 2.1), and the interactive report is sent back by email, using XHTML format with CSS. Sample of inputs and interactive reports are available on the service page.
The online measurement service is available at: http://www.mdworkbench.com/measuring.php
A complete list of implemented metrics is available at: http://www.mdworkbench.com/measurement/metrics/definition.htm
Keywords
|
KM3, UML, Measures, HTML, XHTML, SVG, Pie Chart, Bar Chart |
Overview
|
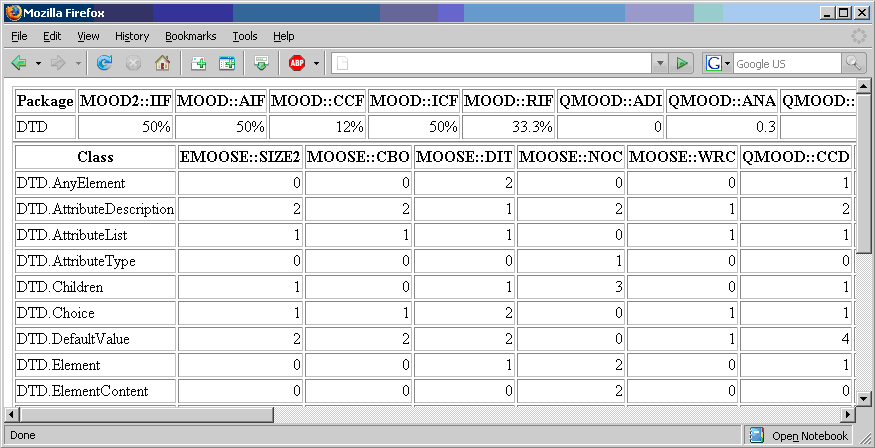
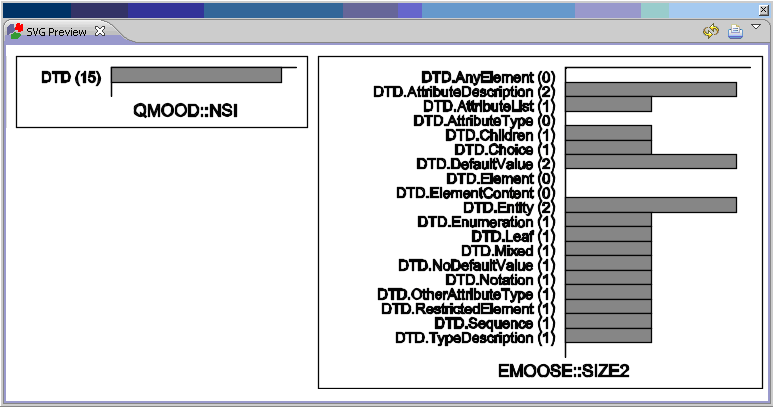
This use case shows how to compute and generate measures on KM3 meta-models or UML models, and how to display them in different way. This use case is composed of two main parts. The first step is the measurement process. Metrics are implemented for KM3 meta-model or UML models using metric sets found in the literature [1]. Each metric set is implemented as an ATL library. An ATL transformation is implemented for each kind of input terminal model and shows how to use the libraries of metrics. A model of Measure is produced at the end of this step. The second step is the presentation process. The computed metrics stored in the model of Measure can be displayed in four different representations: Tabular HTML, SVG Bar Chart, SVG Pie Chart or interactive XHTML with CSS. The figures below present the sample results generated for a KM3 metamodel and for a UML model:
|


References
| [1] | Baroni, A.L.: Formal Definition of Object-Oriented Design Metrics. Master Thesis, Vrije University, Brussel, Belgium, 2002. |
Related Use Cases
Download
| Complete Scenario | Scenario Models Measurement available in the ATL transformation zoo (with source files). |
| Web Service | Online measurement service |
| Definition | Complete list of implemented metrics |
General Information
- July 2007
- By Éric Vépa (SODIUS)
Please, ask your questions on the M2M newsgroup