ATL Use Case - Measuring UML models


Keywords
|
UML Modeler, UML 2, Measures |
Overview
|
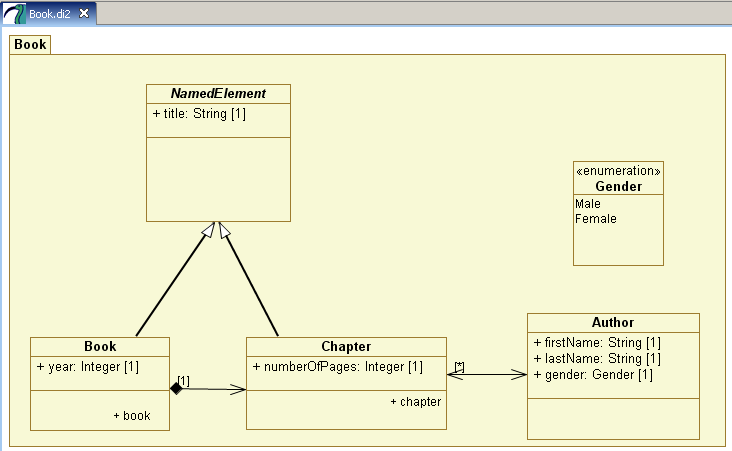
This use case presents how the Papyrus UML Modeler could be used to compute and generate quality measures on UML models. Papyrus is a dedicated tool for UML2 graphical modelling developed mainly by CEA LIST. This open source tool is based on the Eclipse environment. The figure below presents an example of UML Class Diagram made with Papyrus. Measures will be generated and computed on this working example:
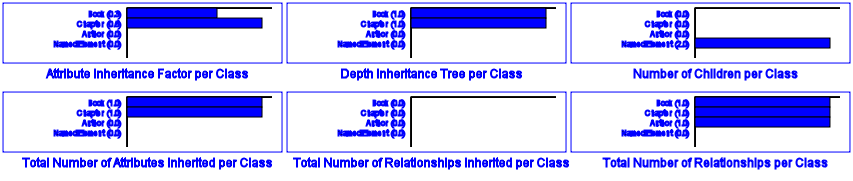
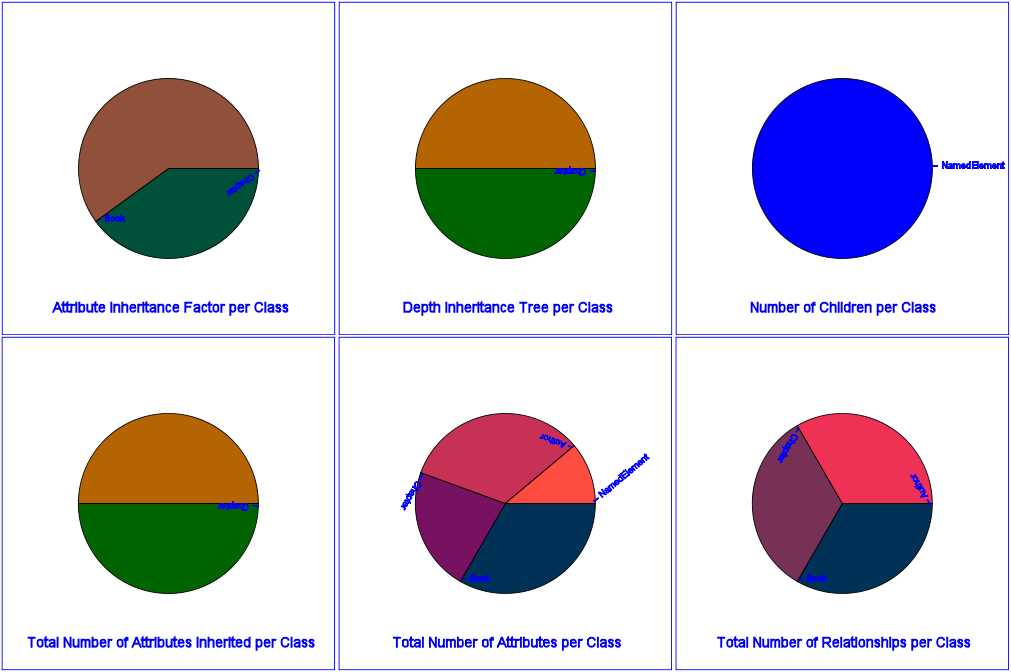
The generation of measures on a UML model allows to perform several investigations. For example measuring the various models may bring interesting insight into the consideration of these models. Furthermore comparing similar measures applied to models of various origins may bring interesting observations. From a UML Class Diagram, the following measures are available and will be computed when the ATL service "Generate Measures" will be executed:
Others and more complex measures could be easily added and implemented by modifying the corresponding ATL transformation. To see how to configure and run the "Measuring UML models" ATL service, please take a look to the User Guide. The computed metrics will be displayed in 3 different representations: Tabular HTML, SVG Bar Chart, and SVG Pie Chart. The figures below present the sample results generated from our working example:
|

Related Use Cases
|
None at the current time. |
Download
|
Papyrus, an open-source graphical modeler tool for UML2 and based on Eclipse. |
ATL Service |
Papyrus add-in containing the implementation of this use case. |
User Guide |
This user guide explains how to configure and launch the ATL service in Papyrus. |
Acknowledgement
| The present work is being supported by the Usine Logicielle project of the System@tic Paris Region Cluster. |
General Information
- May 2007
- By Freddy Allilaire (INRIA), R�mi Schnekenburger (CEA LIST)
Please, ask your questions on the M2M newsgroup