Introduction
Charts are a common and important way to display data in business intelligence and other applications. Business Intelligence and Reporting Tools (BIRT), an Eclipsed-based reporting tool, provides not only a nice report designing tool, but a powerful charting engine. The BIRT Chart Engine is a good choice for displaying charts in your Eclipse plug-ins, Eclipse Rich Client Platform (RCP) applications, Java™ applications, and more. It supports numerous chart types, and can be rendered on SWT/Swing widgets and image files of many formats. In this article, we show you some of the capabilities the BIRT Chart Engine provides, and how to use it on an SWT widget in your plug-in.
What the BIRT Chart Engine can provide
The BIRT Chart Engine supports a variety of chart types. Here, we take a look at some of the available chart choices. Note that only basic and important charts are listed here; you can refer to BIRT documentation for more details.
 |
 |
 |
|
Bar Chart
|
Multi-Bar Chart
|
Line Chart
|
 |
 |
 |
|
Pie Chart
|
Stacked Chart
|
Scatter Chart
|
 |
 |
|
|
Stock Chart
|
Area Chart
|
Figure 1. Chart Samples
Preparation
This article uses Eclipse SDK 3.2.2 and BIRT 2.1.1. The Eclipse Callisto Discovery Site can be used to install BIRT and its prerequisite plug-ins by selecting "Help > Software Updates > Find and Install..." and choosing "Search for new features to install" in the update dialog. After selecting a mirror update site, you can see all features under Callisto Discovery Site as follows.

Figure 2. The Callisto Update Site
In this dialog box, select "Eclipse BIRT Report Designer Framework 2.1.2" and click "Select Required". Now BIRT and all its dependency features are selected to install. Then click "Next", and install all these features.
BIRT contains about fifty plug-ins, but if you use BIRT Chart Engine in your application, you only need four of them (along with several EMF prerequisite plug-ins). They are listed in the following table. So you just need include these four when distributing your application.
|
Plug-in Name
|
Description
|
| org.eclipse.birt.chart.device.extension | Allows third parties to extend the chart render device |
|
org.eclipse.birt.chart.engine.extension |
Allows third parties to extend the chart engine. |
| org.eclipse.birt.chart.engine | Renders charts. |
| org.eclipse.birt.core | Provides basic functionalities for all BIRT plug-ins. |
Table 1. BIRT Chart Engine Plug-ins
You will find all the code snippets shown in this article in the sample code that you can download at com.ibm.examples.chart.zip.
Concepts
Before we start to use the chart engine, let's go through the basic concepts, which can help to understand the chart engine API better. The following is a simple bar chart, which contains the basic elements, like the title, axes, and so on.
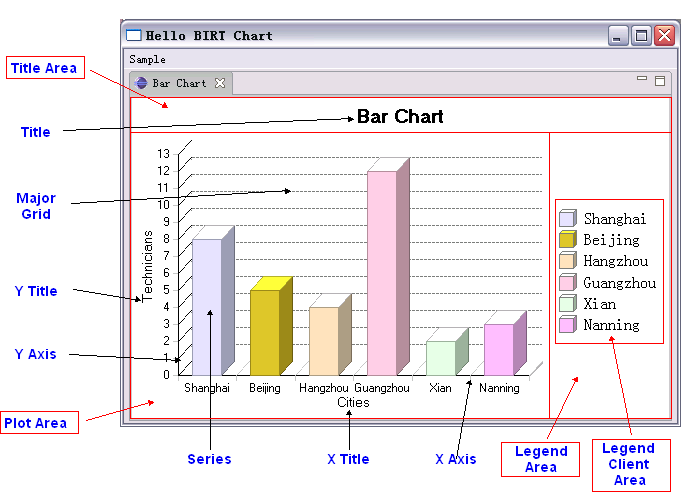
Figure 3. Concepts in a Bar Chart
| Concept | Description |
|---|---|
| Title Area | The area containing the chart's title. |
| Plot Area | The area with red border, containing X and Y axes, the axes titles, and bars. |
| Legend Area | The area that is reserved to host the legend. |
| Legend Client Area | The area containing the legend to explain the meaning of each bar with different series. |
| Title | Describes the data that the chart displays. |
| Major Grid | Indicates the major scale (minor Grid is supported, but not displayed here). |
| X/Y Title | Describes the meaning of X/Y axis |
| X/Y Axis | Provides the label or scale value of X/Y axis |
| Series | Defines how to display data, bar, line, or pie, for example |
Table 2. Some Concepts in Chart.
Most charts have two or more axes, but some have none. One example of a chart with no axis is pie chart. The horizontal axis is called base axis. The base axis can be category axis or value axis. The category axis just contains a sequence of labels, while the value axis contains numeric or datetime values. The vertical axis is an orthogonal axis, and it is always a value axis. The BIRT Chart Engine supports one base axis, and one or more orthogonal axes, but only one orthogonal axis is primary. The series determines how to show data. For example, a bar series will show data with a bar graph, and a pie series shows data with a pie chart. The series definition defines the color palette, label displaying format, and the associated series. Each axis can have more than one series definition, but typically only one series definition is used. A series definition can itself have more than one series.
Create Your First Chart
Let's see how to create a simple bar chart to understand the above concepts. This bar chart has one category base axis, and one orthogonal value axis. It also contains a title and legend as follows:

Figure 4. A Sample Bar Chart.
The complete source can be found in com.ibm.examples.chart.widget.chart.TestChartBuilder.
- Create chart instance
         chart = ChartWithAxesImpl.create();
         chart.setDimension(ChartDimension.TWO_DIMENSIONAL_WITH_DEPTH_LITERAL);
A bar chart has two axes, so we call
ChartWithAxesImpl.create()to create it. The second statement sets dimension withChartDimension.TWO_DIMENSIONAL_WITH_DEPTH_LITERAL, so that the bar is shaded, which looks prettier. - Set background color of plot
        chart.getPlot().setBackground(ColorDefinitionImpl.ORANGE());
        chart.getPlot().getClientArea().setBackground(ColorDefinitionImpl.YELLOW());
The background color of a plot or a plot's client area can be changed. The above code sets the plot's background to orange, and sets the client area's background to yellow.
- Enable legend
        chart.getLegend().setItemType(LegendItemType.CATEGORIES_LITERAL);
        chart.getLegend().setVisible(true);
By default, the legend is disabled, so you need use
Legend.setVisible(true)to enable it. There are two legend types,LegendItemType.CATEGORIES_LITERALandLegendItemType.SERIES_LITERAL. The former shows a different legend icon for each category, and the later shows different icon for each series. - Set the chart title
        chart.getTitle().getLabel().getCaption().setValue(title);
        chart.getTitle().getLabel().getCaption().getFont().setSize(14);
        chart.getTitle().getLabel().getCaption().getFont().setName(FONT_NAME);
Setting the chart title is very simple, as the first line shows. You can also set other attributes, like the font size, font name, font style, and more.
- Create axes
 xAxis = ((ChartWithAxes) chart).getPrimaryBaseAxes()[0];
xAxis.getTitle().setVisible(true);
xAxis.getTitle().getCaption().setValue(xTitle);
     xAxis = ((ChartWithAxes) chart).getPrimaryBaseAxes()[0];
        xAxis.getTitle().setVisible(true);

        xAxis.getTitle().getCaption().setValue(xTitle);


     yAxis = ((ChartWithAxes) chart).getPrimaryOrthogonalAxis(xAxis);
        yAxis.getTitle().setVisible(true);
        yAxis.getTitle().getCaption().setValue(yTitle);
        yAxis.getScale().setStep(1.0);
yAxis = ((ChartWithAxes) chart).getPrimaryOrthogonalAxis(xAxis);
yAxis.getTitle().setVisible(true);
yAxis.getTitle().getCaption().setValue(yTitle);
yAxis.getScale().setStep(1.0);
We get
the first primary base axis as the X axis, while the Y axis is
orthogonal to the X axis. By default, the title of the axis is not
visible, so we enable that for both axes and set their titles. Finally,
we specify the scale step on Y axis as 1. - Create the X series TextDataSet categoryValues = TextDataSetImpl.create(dataSet.getCities());
Series seCategory = SeriesImpl.create();
seCategory.setDataSet(categoryValues);
 SeriesDefinition sdX = SeriesDefinitionImpl.create();
sdX.getSeriesPalette().update(1);
SeriesDefinition sdX = SeriesDefinitionImpl.create();
sdX.getSeriesPalette().update(1);
 xAxisPrimary.getSeriesDefinitions().add(sdX);
sdX.getSeries().add(seCategory);
xAxisPrimary.getSeriesDefinitions().add(sdX);
sdX.getSeries().add(seCategory);
The first thing to create the X series is
to
create the data set to bind. There are four types of data set: they are
DataTimeDataSet,NumberDataSet,StockDataSet, andTextDataSet. In this example, the X axis is a category axis, so we useTextDataSet. Then, we create a series,
and bind the data set to it. In order to define what the series looks
like, we need to
create a series definition. The BIRT Chart Engine predefines two color
palettes. Here we choose the first series palette. Finally, we add the series
definition to X axis, and add the series to the series definition. - Create the Y series NumberDataSet orthoValuesDataSet1 = NumberDataSetImpl.create(dataSet.getTechnitians());
BarSeries bs1 = (BarSeries) BarSeriesImpl.create();
bs1.setDataSet(orthoValuesDataSet1);
SeriesDefinition sdY = SeriesDefinitionImpl.create();
yAxisPrimary.getSeriesDefinitions().add(sdY);
sdY.getSeries().add(bs1);
Creation of the Y series is similar to that of the X series. Here, the Y axis must be a value axis, so we use a
NumberDataSet.
In the next section, we will see how to make this chart display on an SWT canvas.
Create the Chart Canvas
The BIRT Chart Engine doesn't provide a SWT chart widget that can
be used directly, so we need create it by ourselves if we want to
display a chart in an editor or view. In the following example, we
create the ChartCanvas class, which extends from Canvas.
        public class ChartCanvas extends Canvas {

            ...

            public ChartCanvas(Composite parent, int style) {
                super(parent, style);

                // initialize the SWT rendering device
                try {
                 PluginSettings ps = PluginSettings.instance();
                    render = ps.getDevice("dv.SWT");
                } catch (ChartException pex) {
                    DefaultLoggerImpl.instance().log(pex);
                }
                ...
In the constructor, ![]() we need to get the device renderer for
SWT. The device renderer is responsible for rendering a chart onto a
target device. The target device can be an image file or widget toolkit
like SWT or Swing. The BIRT Chart Engine defines nine device renderers
in
we need to get the device renderer for
SWT. The device renderer is responsible for rendering a chart onto a
target device. The target device can be an image file or widget toolkit
like SWT or Swing. The BIRT Chart Engine defines nine device renderers
in org.eclipse.birt.chart.util.PluginSettings; they are
shown below:
| Device Name | Description |
|---|---|
| dv.SWING | Renders a charts using Swing's java.awt.Graphics2D. |
| dv.SWT | Renders a chart using SWT's org.eclipse.swt.graphics.GC. |
| dv.PNG24 | Renders a chart to a 24-bit PNG file (deprecated). |
| dv.GIF8 | Renders a chart to an 8-bit GIF file (deprecated). |
| dv.PNG | Renders a chart to a PNG file. |
| dv.GIF | Renders a chart to GIF file. |
| dv.JPEG/dv.JPG | Renders a chart to a JPEG file. |
| dv.BMP | Renders a chart to a BMP file |
| dv.SVG | Renders a chart to an SVG file (requires the org.eclipse.birt.chart.device.svg
plug-in). |
Table 3. Available Device Renderers.
We selected dv.SWT as our device renderer, since we
will render chart on an SWT widget. In the constructor, we add one paint
listener to do the actual painting work.
We use double-buffering to draw the chart on the canvas to avoid
flickering while the chart is being drawn. In the paint listener ![]() , if this
is the first time to get paint event, we
, if this
is the first time to get paint event, we ![]() build the chart via the
build the chart via the buildChart()
method, and then ![]() draw the chart on an
draw the chart on an org.eclipse.swt.graphics.Image
named cachedImage through the drawToCachedImage(...)
method.. Thereafter, the cached image is used to draw the chart with a
call to GC.drawImage(...) ![]() to draw the cached image on the
widget. The
to draw the cached image on the
widget. The buildChart(), and drawToCachedImage(...)
follow:
            private void buildChart() {
                Point size = getSize();
                Bounds bo = BoundsImpl.create(0, 0, size.x, size.y);
                int resolution = render.getDisplayServer().getDpiResolution();
             bo.scale(72d / resolution);
                try {
                 Generator gr = Generator.instance();
                 state = gr.build(render.getDisplayServer(),
                                     chart,
                                     bo,
                                     null,
                                     null,
                                     null);
                } catch (ChartException ex) {
                    DefaultLoggerImpl.instance().log(ex);
                }
            }
The buildChart() method is responsible for building
the runtime chart state with the render display server. One important
thing to do is to scale the bounds of chart from pixel to point. SWT and
other screen based renders always use pixels as the logical unit.
However, the BIRT Chart Engine uses points, which is an absolute unit (1
point = 1/72 inch). We need to ![]() scale the bounds of chart from pixels to
points. Another important step is to
scale the bounds of chart from pixels to
points. Another important step is to ![]() get a
get a Generator instance and ![]() build the
runtime chart state with the given chart model and display server. So
the generated runtime chart state takes all necessary information to
render, which includes the
build the
runtime chart state with the given chart model and display server. So
the generated runtime chart state takes all necessary information to
render, which includes the DisplayServer, chart model, and
the bounds. The DisplayServer provides rendering-related
information, like DPI (Dots Per Inch) resolution. The bounds define the
area that the generated chart will be drawn on.
            public void drawToCachedImage(Rectangle size) {
                GC gc = null;
                try {
                    if (cachedImage != null)
                        cachedImage.dispose();
                    cachedImage = new Image(Display.getCurrent(), imageData);

                 gc = new GC(cachedImage);
                 render.setProperty(IDeviceRenderer.GRAPHICS_CONTEXT, gc);

                    Generator gr = Generator.instance();
                 gr.render(render, state);
                } catch (ChartException ex) {
                    DefaultLoggerImpl.instance().log(ex);
                } finally {
                    if (gc != null)
                       gc.dispose();
            }
In the drawToCachedImage(...) method we draw the
generated runtime chart state on the cached image. First, we ![]() create a
create a
GC for the cached image, and ![]() set it into the renderer with
the property name
set it into the renderer with
the property name IDeviceRenderer.GRAPHICS_CONTEXT. Then,
generator ![]() asks the
renderer to perform actual rendering with the generated runtime chart
state. Finally, we dispose the
asks the
renderer to perform actual rendering with the generated runtime chart
state. Finally, we dispose the GC to ensure that underlying
system resources are released.
Next, we get a SWT canvas widget to display chart and also go
through the process to render the chart to a specific device. Now you
can create an instance of ChartCanvas, assign a chart
instance to it, and insert this canvas into the view.
Others
Render Chart to File
The BIRT Chart Engine also supports the rendering of a charts
directly to a file. The process is similar to the above. The difference
is the render device and you needn't use a cached image. First, get the
render device for PNG files. Then, set the render property, IDeviceRender.FILE_IDENTIFIER,
with file name. The other steps are as same as rendering chart on
screen.
            try {
                PluginSettings ps = PluginSettings.instance();
                render = ps.getDevice("dv.PNG");
                render.setProperty(IDeviceRenderer.FILE_IDENTIFIER, "chart.png");
            } catch (ChartException ex) {
                DefaultLoggerImpl.instance().log(ex);
            }
Conclusion
This article introduces the whole process of using the BIRT Chart Engine in plug-in development. BIRT Chart Engine supports almost all types of chart, including bar charts, pie charts, and more. It also has good abstraction for device renderers, and supports many rendering devices, including SWT widgets, SWING components, numerous file formats (JPEG, GIF, and PNG), and more. Although this article focuses on rendering chart on SWT canvas, the concepts and process to render on other devices are similar.