| Release | Resolved | Community Contributions |
| 2.2 10 Dec 2013 |
30 bugs | Minor release containing SystemTap graphing upgrades, LTTng upgrades, making OPerf the default tool for OProfile profiling, plus the addition of comparison editor support for perf stat data files, in addition to bug fixes. |
New in Linux Tools 2.2
- LTTng (4)
- OProfile Profiling (1)
- Perf Profiling (1)
- RPM .spec Editor (2)
- RPM Stubby (1)
- SystemTap Integration (1)
Linux Tracing Toolkit
|
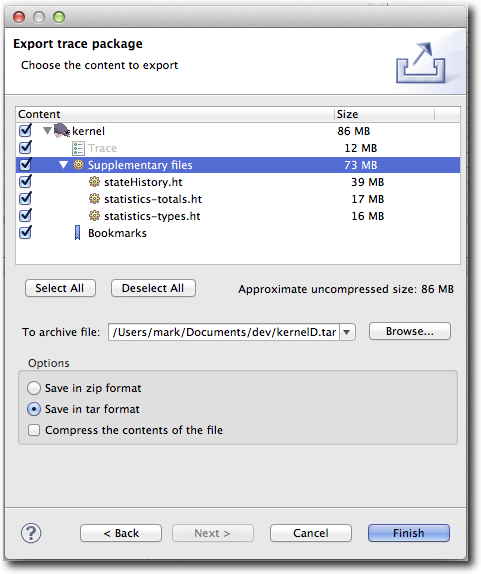
Import and Export Trace Package |
The importing and exporting of trace packages is now supported.
A trace package is an archive containing the trace files, metadata to describe
the trace type, and optionally the supplementary files and bookmark information.
|
|
|
|
|
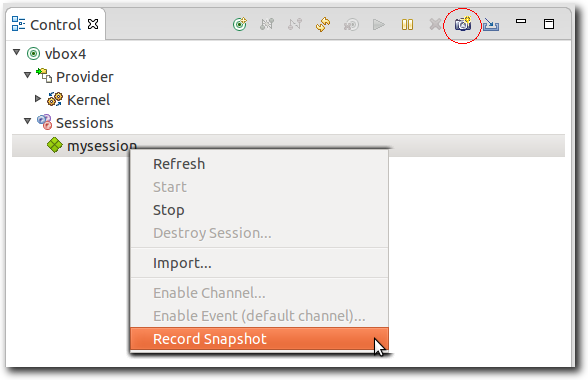
Support for LTTng Tools v2.3 |
The Control view now supports version v2.3 of LTTng Tools.
It is now possible to create snapshot tracing sessions. Many snapshots can
be recorded during a tracing session and each snapshot can then be imported
to the project.
|
|
|
|
|
Control View Improvements |
|
|
|
|
|
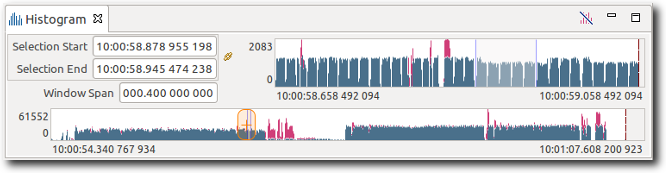
Histogram View Improvements |
Many improvements were done to the Histogram view.
The view layout and text controls is updated. The selection and
zoom window can be controlled more easily with the mouse buttons.
Lost events can be displayed and the window range is represented
more accurately.
|
|
|
|
|
Export to Text |
It is now possible to export a trace to a text file.
The file will contain each event's fields in a tab-delimited format.
The output will discard filtered-out events.
|
|
|
|
OProfile Profiling
|
OPerf support as the default |
The OPerf tool provided by OProfile (0.9.8+) is now the default option when profiling using the standard OProfile launch shortcut. 
|
|
|
|
Perf Profiling
|
Perf Comparison Integration With Platform |
The comparison viewers for perf-report, and perf-stat results are now activated through team support. Simply select the two files to be compared, right click for the context menu, go to "Compare With", and select "Each Other". 
|
|
|
|
RPM Stubby
|
Eclipse template uses tycho if possible |
The previous RPM Stubby feature.xml template has been improved upon to use tycho if possible. Depending on whether or not RPM Stubby detects a parent pom.xml will determine how the template will be made. A pom-less project will have RPM Stubby generate a dummy parent pom.xml for feclipse-maven-plugin to use. More information on the guidelines for this procedure can be viewed at Java Packaging Guidelines Information on feclipse-maven-plugin can also be viewed at feclipse-maven-plugin 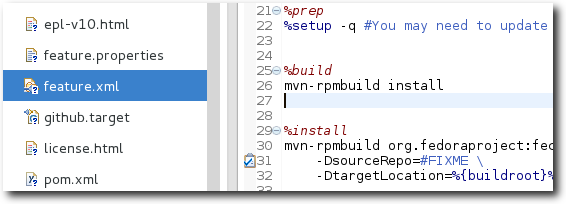
|
|
|
|
RPM .spec Editor
|
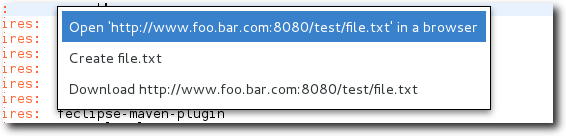
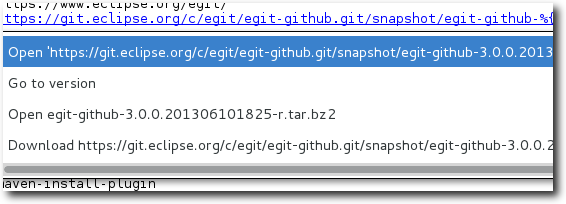
Improved hyperlinking |
Hyperlink options (shown by Ctrl + hovering over certain .spec file elements, such as URLs) have been cleaned up. In addition, improvements have been made to accomodate proper use of URLs in SOURCE and PATCH defines. For more information on how to use the Specfile Editor, see the User Guide.
Before Options Cleanup
After Options Cleanup |
|
|
|
|
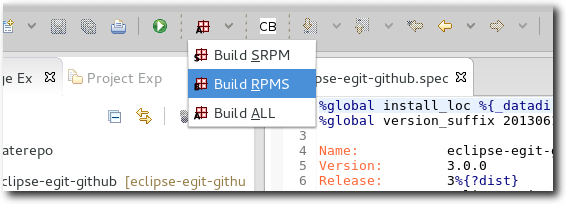
New RPM Menu and Toolbar |
RPM has improved its menu to be more easily navigatable and to also give the user the option to build RPMs. A user can now use the menu's build commands as opposed to having to go through the export wizard (now deprecated) to build the RPMs. In addition, a toolbar has been added to give the user easy access to the build commands without having to go through the context menu.
|
|
|
|


SystemTap Integration
|
New Output Graphing Features |
Changes have been made to the Graphing menu interface (found in Run Configurations) to provide users with greater flexibility when creating graphs that plot a script's output. The output to capture is now specified by a complete, user-defined regular expression, with the data to plot being defined by parenthesis groups. Several of these regular expressions may be used at a time. For added clarity, the user may also input a line of text with which to test their expression in the "Sample Output" text box. 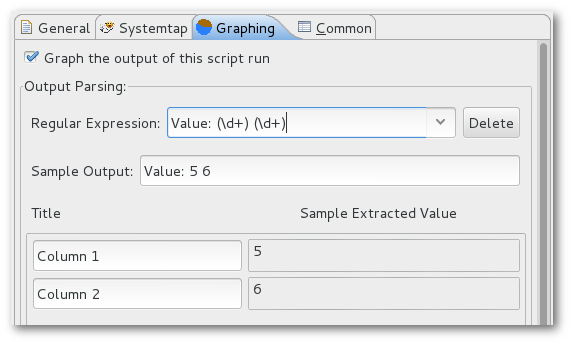
In addition, graphs may now be edited after having been created. 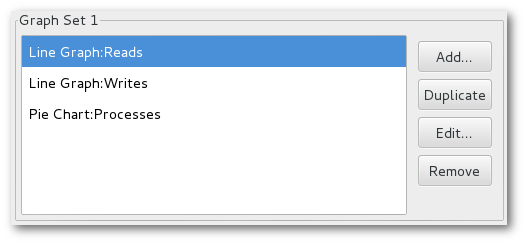
|
|
|
|