| Release | Resolved | Community Contributions |
| 0.4 23 Nov. 2009 |
84 bugs | Our Eclipse SDK build harness, eclipse-build, would be much worse off if it weren't for the patches and testing by Benjamin Drung, Matthias Klose, Marvin Schmidt, and Niels Thykier. Nick Boldt once again helped us with some release engineering issues. Thanks to users such as Jens Seidel, Andrew Gvozdev, and PurpleFloyd for reporting some key bugs against Autotools and testing the subsequent fixes. |
New in Linux Tools 0.4
- GNU Autotools Support (2)
- Eclipse Callgraph (2)
- Building the Eclipse SDK (7)
- GProf support (3)
- RPM Stubby (1)
- RPM .spec Editor (1)
- Valgrind Profiling (2)
GNU Autotools Support
|
Project Templates |
The GNU Autotools plug-in now provides template projects for both C and C++ in the CDT C and C++ Project Wizards. There are two templates for each language: an empty project template used when importing existing projects and a sample "Hello World" project template. The "Hello World" sample project templates provide all needed source and configuration files such that the build produces a working executable that prints to the console. 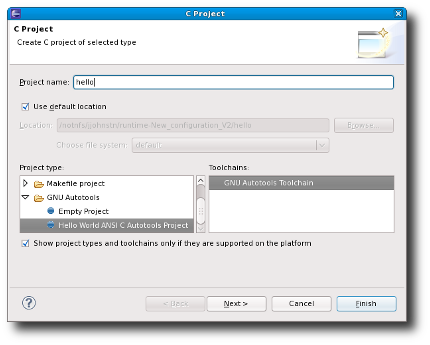
|
|
|
|
|
Autotools Configuration |
The Autotools plug-in has been rewritten. As part of the rewrite, the configuration settings have been moved under the Autotools properties page. Configuration options are now stored in a new project xml file: .autotools. The build directory is no longer specified in the configuration settings. It is specified exclusively using the "Build Location" setting found in the C/C++ Build properties page. 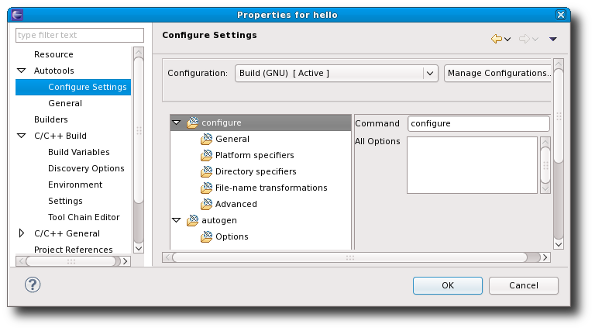
If the build location is not set, then by default, the initial build will occur in the top-level project directory. Subsequent builds will build in new directories which are named "build-${CfgName}" where ${CfgName} is the name of the configuration. If this behaviour is not desired, it can be turned off from the top-level Autotools property page. 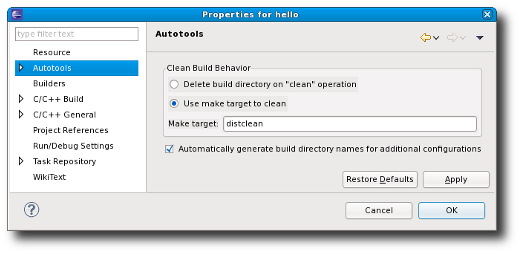
For further information about rewrite changes, click here. |
|
|
|
Eclipse Callgraph
|
Visualize C/C++ Projects |
Graphically displays the call hierarchy from executing a C/C++ binary, along with various other runtime statistics. 
|
|
|
|
|
Link To Function Source |
The graph views are linked to their source code. This means that from any view, one can jump directly to the relevant source code by holding Ctrl and double clicking a node. 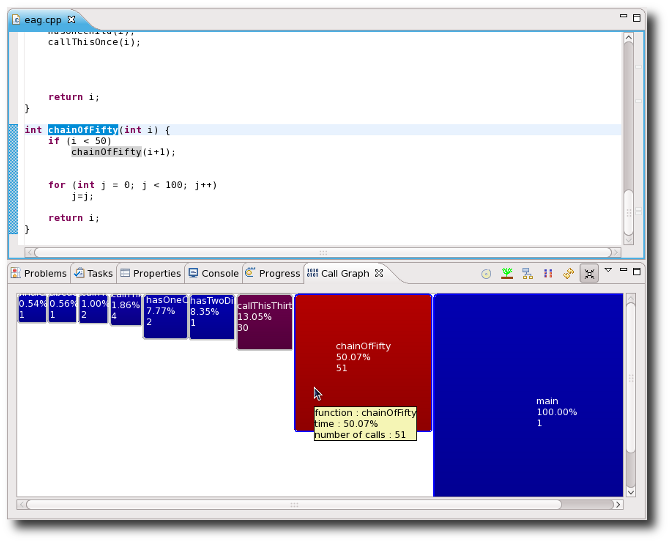
|
|
|
|
Building the Eclipse SDK
|
Update to latest Eclipse SDK version |
Build is updated to work with Eclipse SDK 3.5.1 version. |
|
|
|
|
Running SDK Tests |
The Eclipse SDK test suites can be run with ant runTests. A single HTML file with aggregated results will be created. |
|
|
|
|
GTK 2.18 compatibility |
Eclipse 3.5.1 has problems running with GTK 2.18. Compatibility patches which will appear in 3.5.2 have been back-ported and included. |
|
|
|
|
Build more... |
ECF bundles and Equinox initializer are built as part of the build process. |
|
|
|
|
Enhance distributions' experience |
Install target has been added to install provisioned SDK. |
|
|
|
|
Additional Architectures |
Support for the following additional architectures has been added:
|
|
|
|
|
Speed up build |
Build has been changed to work with only one target os-ws-arch. |
|
|
|
GProf Integration
|
Configuration |
The Gprof plugin allows the generation of execution performance statistics based on compiler instrumentation. Thus, the user has to compile the C/C++ program with profiling enabled using the -pg option prior to running the tool. 
|
|
|
|
|
Launching |
Once the application run is finished, a gmon.out file is generated under the project. Double clicking on this file will open a dialog to select the associated binary. 

|
|
|
|
|
Results |
The Gprof view shows which parts of the program consume most of the execution time. It also provides call graph infomation for each function. Source code can be viewed in an editor by double clicking on a function in the tree.
|
|
|
|

RPM Stubby
|
Maven generation |
RPM Stubby now has support for generating RPM spec files from Maven pom.xml files. 
|
|
|
|
RPM .spec Editor
|
General cleanup |
The .spec editor code has been updated to use Eclipse SDK 3.5 API. Issues found by PMD/Findbugs are also fixed. |
|
|
|
Valgrind Profiling
|
Valgrind 3.5 Support |
Valgrind 3.5 brings several changes to the tool suite, such as improved leak checking. For the Linux Tools 0.4 release, an issue has been corrected that prevented launching a program successfully with default Valgrind options. Valgrind 3.5 users should now have no problems profiling their C/C++ applications in Eclipse. |
|
|
|
|
Customize Valgrind Location |
A new preference page accessible from Window -> Preferences allows you to specify an alternate location for the Valgrind executable. This defaults to the path returned by the which command. Now you can use Valgrind from a non-standard location without having to manipulate your PATH environment variable. 
|