Spring Tools for Eclipse IDE
Spring is everywhere
Spring is everywhere. It is at the heart of most modern business applications, in the center of modern cloud-based microservice applications, and used by millions of developers around the globe. And Spring Boot is at the heart of the current renaissance of Spring, making it easy, convenient, and extremely efficient to implement applications and services on top of Java.
Spring Tools for Eclipse IDE
To make it even easier to write modern Spring Boot applications, the latest generation of the Spring Tools for the Eclipse IDE are well suited for getting started with Spring Boot and working on large microservice applications that are based on Spring Boot. This article walks you through the most important features of the tooling and provides great insight into a number of tips and tricks along the way.
Installation
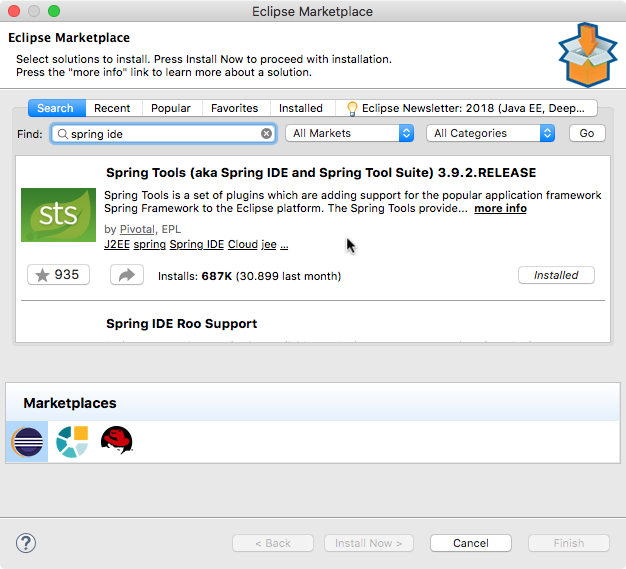
You can install the Spring Tools for Eclipse IDE into an existing Eclipse installation using the Eclipse Marketplace. Just open the marketplace client in Eclipse, search for Spring Tools and install the “Spring Tools (aka Spring IDE and Spring Tool Suite)” entry.
In case you prefer to use a ready-to-use distribution, you can go to https://spring.io/tools and download the Spring Tool Suite distribution, which is a full Eclipse distribution (based on the latest Eclipse release) with Spring Tools pre-installed.
Creating Spring Boot projects from scratch
The most famous way to create new Spring Boot projects is to go to https://start.spring.io and choose which Spring starter modules you wanna use. Once you do that, you can download a ZIP file of your new project and import that into your development environment.
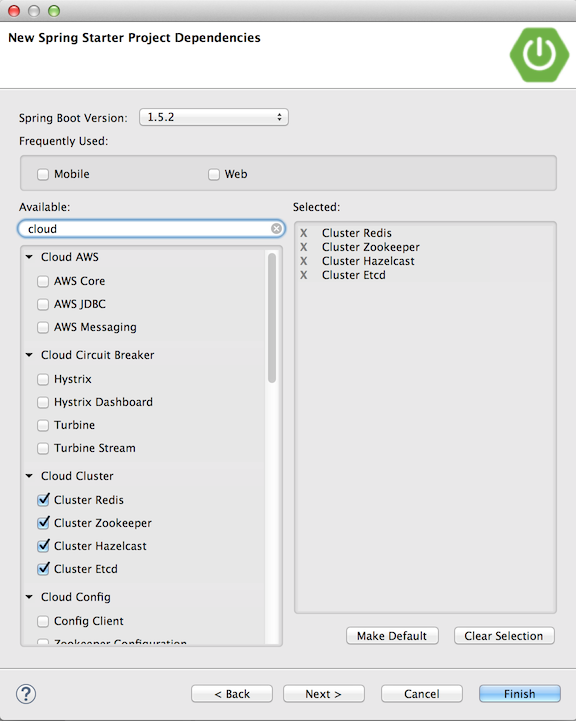
The Spring Tools for Eclipse IDE come with a direct integration of that into your Eclipse IDE. Go to "File", select "New" and choose the "Spring → Spring Starter Project". The wizard lets you choose the Spring Initializr endpoint you would like to use (in case you have a custom one running within your company, for example) and then lets you select a boot version and offers all the Spring Boot starter modules that are around for that boot version. Just choose the ones that match your interest and click “Finish”. You end up with a ready-to-use Spring Boot project in your workspace - in just a few seconds.
Using Spring Guides
In case you want to learn about a specific area of Spring and Spring Boot, you might want to take a look at the Spring Guides: https://spring.io/guides. They offer a comprehensive set of small tutorial-like step-by-step introductions to specific features of Spring. You can use them, for example, to learn how to implement your first RESTful service that delivers JSON.
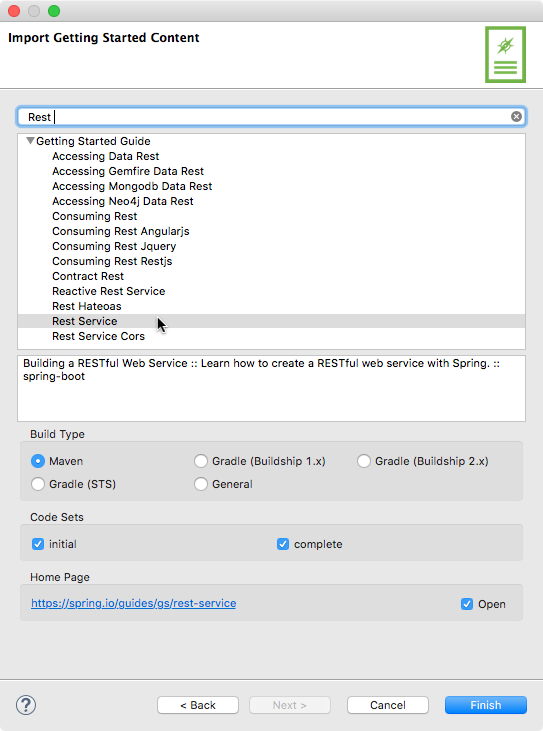
Those guides can be imported into your Spring-Tools-enhanced Eclipse IDE by using the “Import Spring Getting Started Content” wizard, also available from the “New” menu. It is a great way to quickly import those guide projects, try them out, and learn from them.
Running Spring Boot apps
Suppose we have a simple Spring Boot application that we got from importing the “Rest Service” guide. It implements a simple @RestController and serves some JSON back to the user. In order to run this app, you could select “Run As → Spring Boot App” or create your own launch configuration in the Eclipse IDE. A better and easier way to run your Spring app is the Spring Boot Dashboard. It is a separate view in your IDE that you can activate from the toolbar (look for the Spring Boot icon).
The Spring Boot Dashboard lists all the projects from your workspace that are Spring Boot projects. You can select one or multiple projects and run them just by hitting the “(Re)Start” button. It will create a default launch config for your Spring Boot app automatically if you don’t have one yet.

The Spring Boot Dashboard helps you to deal with potentially many Spring Boot apps in your workspace. It allows you to filter them, start or even restart multiple apps in parallel, or easily jump to the right console view for a running app.
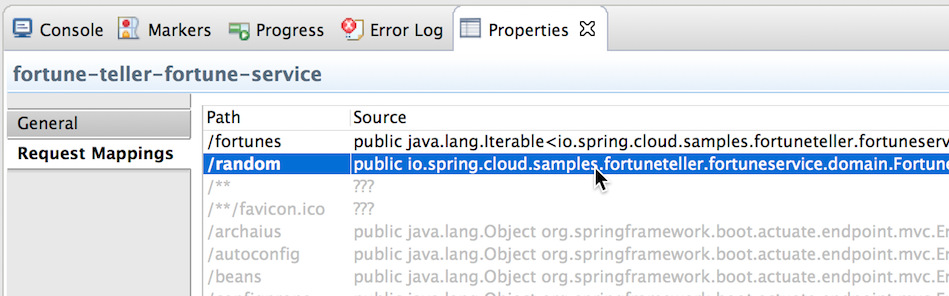
The Spring Boot Dashboard, in addition to managing the launching of apps, offers more facilities for gaining insights into your applications. Jumping to the properties view from a running and selected Spring Boot app in the dashboard, you will see not just a quick overview and a ready-to-use hyperlink that lets you jump to the frontend of the running app immediately (without looking up port numbers, etc.). You will also see two additional tabs that provide direct information from the running app: request mappings and beans. The request mappings tab, for example, shows you all the request mappings that the application serves together with its location in the source code. Double-clicks let you jump directly to the source code where the mapping is implemented. This allows you to easily navigate between your running app and your source code.
The beans tab offers you the list of beans that are live at runtime, created by the Spring application. You can browse through the list or filter for certain characters. The good thing here is that you can also see dependencies among those beans, so that you can gain insight into which bean depends on which other bean. You want to know, for example, which data source got injected into your controller? Search for your controller name in the list of live beans and you will see the answer right away.

Working with properties
Spring Boot does a lot of things automatically for you. But that doesn’t mean you can’t customize this default behavior. One way to customize the behavior is in code, the other one is by using properties. And Spring Boot offers a huge number of properties.
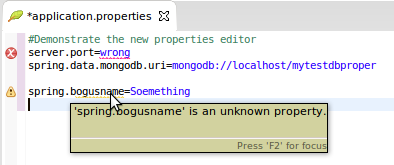
Assuming you want to define the port your Spring Boot app is running on. Just open the “application.properties” or “application.yml” file (depending on whether you prefer property or YAML format for your config files) and go. The Spring Tools for Eclipse IDE provide an enhanced editor experience that offers code completion for all the available Spring Boot properties.

Beyond the code completion, which offers a full list of properties together with documentation hints and types of those properties, the editor also checks keys and values for correctness. If, for example, a property is unknown, it will let you know via a warning. If the value that you put in doesn’t match the type of the property, an error will appear.
Deploying to Cloud Foundry
Last, but not least, the Spring Boot Dashboard provides a direct integration with Cloud Foundry runtimes. In the same way as your local boot apps, a Cloud Foundry section in your dashboard will list the deployed and running apps, allows you to start and stop them. It also offers you to deploy your project via drag&drop to the Cloud Foundry instance and even debug a running app on Cloud Foundry.
What about pre-Boot Spring applications?
The Spring Tools for Eclipse IDE offer a whole lot of additional features if you work on pre-Boot Spring projects, even if you will configure your Spring application using XML application context definitions. But walking through all of those features would be way beyond the scope of this article.
Spring Tools 4: The new generation on the horizon
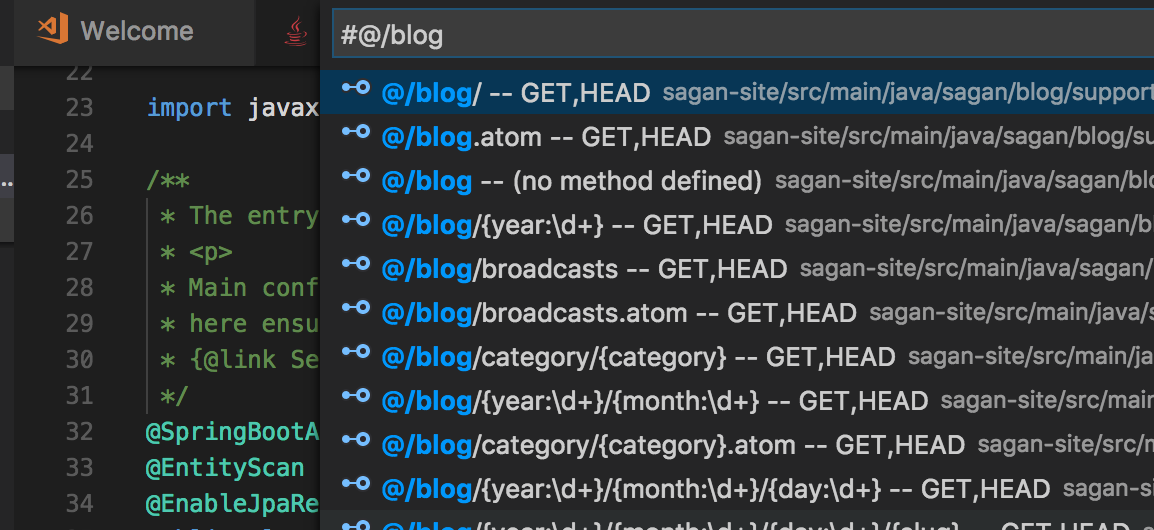
In the final section of this article, I want to give you a brief outlook at what is coming next. In December 2017 we launched the public beta of the next generation of Spring tooling. The so-called “Spring Tools 4” initiative and the corresponding public beta launch not just offers great tooling for Spring apps when working with the Eclipse IDE, but is also available for Visual Studio Code and Atom: https://spring.io/tools4.
The next generation includes all of what you have seen here in this article so far, and goes beyond that. It offers a super quick and easy source-code navigation to all the important pieces of your Spring Boot application. You will get easy access to all your request mappings, bean definitions, function implementations, data repositories, and more - just by selecting the “Go To Symbol” action.
In addition to that, your source code will be augmented with information from running Spring Boot applications. As soon as you start your Spring Boot app, real-time information from that app will appear in your source code, allowing you to get a unique insight into your running Spring Boot app. You will be able to see which beans are active, how they got wired to each other, which conditions have succeeded or failed and for what reason, and more.
Wanna give it a try? Feel free to take a look at: https://spring.io/tools4 - download and go! It is available as a ready-to-use Eclipse distribution (based on Eclipse Photon), and as extensions for Visual Studio Code, and Atom.
And feedback is always welcome. Please feel free to go to https://github.com/spring-projects/sts4/issues and raise questions, provide feedback, and report bugs and enhancement requests.
About the Author