Beginning BIRT: A Practical Introduction
Want to build compelling and meaningful data visualizations that can be integrated into rich-client or web applications? Go with BIRT. With components for both designing and deploying data visualizations, BIRT provides core features such as design layout, data access and scripting.
I have compiled this overview to provide a practical introduction to both the design and deployment aspects of BIRT. I start by describing the overall BIRT architecture and the various packages available for download from eclipse.org. Then I introduce the report designer tool, called BIRT Designer; I also describe some basic options for customizing BIRT designs, walk you through creation of a simple design and explore some scripting possibilities.
Next, I’ll explain some of the options BIRT gives you to deploy your visualizations. You can run BIRT reports directly from BIRT Designer, but if you need to reach large groups of users you’ll want to explore some of the other deployment options I describe, such as BIRT Runtime or BIRT Web Viewer. I’ll conclude the article by listing some resources you’ll need as you explore BIRT.
Report Design and Report Engine Components
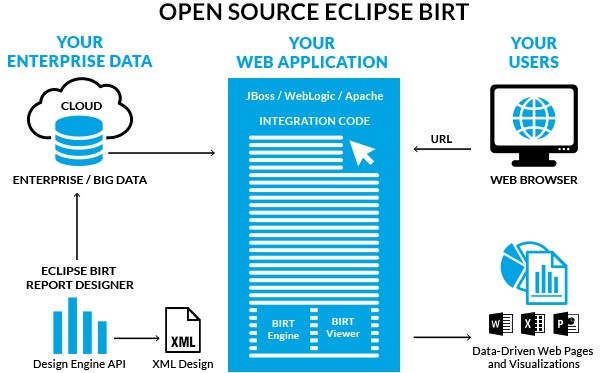
Open Source BIRT has two main components: a design engine that is integrated into the report designer based on Eclipse and the report engine which you can add to your application. The BIRT Web Viewer is also available as an example web application deployment that uses the report engine to render reports. These components will be discussed in more detail throughout the article.
Where to download and which version to get?
Open source BIRT can be downloaded from http://download.eclipse.org/birt/downloads. There are several different packages containing BIRT, so you can choose one that is right for your needs.
| Package | Uses |
| BIRT All-In-One Download | This package includes everything you need to start creating BIRT designs, including the full Eclipse SDK. |
| BIRT Framework | This download allows you to add the BIRT plug-in to your existing Eclipse environment. (Make sure you check the dependencies and update those too.) |
| Eclipse Update Manager | This package enables you to integrate BIRT into your existing Eclipse environment (http://wiki.eclipse.org/BIRT_Update_Site_URL). Be sure to also select the Data Tools Project when using this approach. |
| RCP Report Designer | This package lets you deploy BIRT using Eclipse Rich Client Platform (RCP) technology. It provides a simplified report designer without the additional perspectives of the standard Eclipse platform. |
| BIRT Runtime Engine | Deployment components of the BIRT project including a command line example, API examples and example web viewer. This package is available as a POJO runtime or OSGi runtime. |
| BIRT Web Tools Integration | Contains the plug-ins required to use the BIRT Web Project Wizard and the BIRT Viewer JSP tag library. |
Tour the BIRT Designer
BIRT Designer is a visual report development tool with task-specific editors, builders and wizards that enable you to create data visualizations that can be integrated into web applications. The BIRT report designer supports:
- A component-based model for reuse of designs and elements
- Ease of use features in a drag-and-drop, WYSIWYG format
- Support for a wide range of reports, layouts and formatting
- Programmatic control, so report content can be built and controlled through scripting
- Data access across multiple data sources
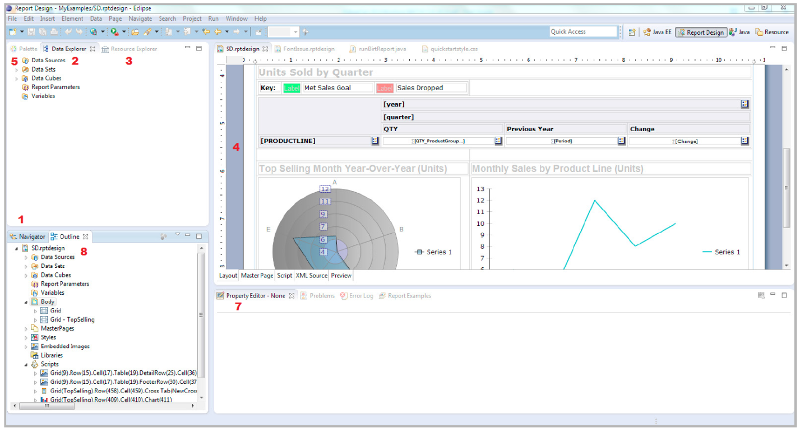
The BIRT Designer window. Red numbers refer to descriptions below.
BIRT Navigator (1)
This is where you start when you open BIRT for the first time. In this area, you’ll see all of the projects in your workspace. When you want to create a new Report Design Project or a new BIRT file within a project, this is the place to go. Below you’ll see a table of the different file types you can create in BIRT.
| Type of file (and suffix) | Description |
| Design File (*.rptdesign) | An XML file that contains the data connection information, design layout and instructions. Created when making a design in the BIRT Designer. |
| Template File (*.rpttemplate) | Ensures all reports you create start with some common elements, such as a company header or predefined styles. The starting point for a BIRT report. |
| Library File (*.rptlibrary) | Stores commonly used report elements, such as a company logo, so they are managed in one place for all reports. |
| Report Document (*.rptdocument) | The executed design, including layout instructions and data. Can be transformed into final report output, such as HTML, PDF and XLSX. |
Data Explorer (2)
Once you have created your project and design file in the Navigator, go here next. This is where you create and view all of the Data Sources, Data Sets, Data Cubes and Report and Page Variables.
Data Sources
The BIRT project has been designed to natively access and support many data sources, as shown in the table below. Supported data sources can be extended using the Eclipse ODA framework to support any data to which you have access. In addition to the list below, BIRT ships with a connection to a sample database (called Classic Models). BIRT also includes a Joint Data Set which allows you to join data across data sources, no matter the type.
| Data Source | Connection Information |
| Flat File | Supports tab, comma, semicolon and pipe delimited data. |
| JDBC | Supports connections to relational databases. |
| Scripted | Allows you to implement custom logic, communicate with Java objects, or get access to data within your application. It can be used to access virtually any data source that is structured or that contains an API. |
| Web Services | Supports connections to a web service. A wizard helps you point at a service through a WSDL and select the data. |
| XM | Supports data from XML. |
| Hive/Hadoop | Allows access to Hadoop data through Hive using Hive Query Language (HQL). If you use Hive 2, please ensure that you copy the client library JAR files to the appropriate folders for both BIRT Designer and the BIRT Runtime deployment application. |
| POJO | Allows for easy connection to POJOs. |
| MongoDB | Provides the ability to access data contained in MongoDB. |
Cassandra Scripted
|
BIRT connects to and queries a Cassandra data source using the Hector API. You must copy the Hector client library JAR files to the appropriate folders for both BIRT Designer and the BIRT Runtime deployment application. |
| Excel | Initially contributed by the community, this connector allows you to pull in data from Excel Workbooks. |
| Additional Data Sources | BIRT has been extended by the open source community allowing additional data connections to LDAP, Report Documents, LinkedIn, Facebook, GitHub, SalesForce and Spring Beans. |
Resource Explorer (3)
Next to the Data Explorer, you’ll see the Resource Explorer. This is where you’ll find all of your resources that can be used in your design, such as libraries, images and js files.
Layout (4)
The main portion of the designer is the Layout view. This is where you create your WYSIWYG design. Below this window, you’ll also see tabs that will allow you to see your Master Page, the Script on a selected element, the design’s XML Source and a Preview of your design.
Palette (5)
Now that you’ve created your project and your design and connected to your data, you’re ready to start building the design layout. To insert an element into your layout from the Palette, simply drag and drop it. The table below lists available items, including a breakdown of the available chart types.
| Tool | What it does |
| Label | Use to include static (or localized) text within a report. Typically used for report titles, column headers or any other report text. |
| Text | Use to include richly formatted text to your report, including HTML formatting integrated with dynamic data. |
| Dynamic Text | Use to integrate static text with dynamic or conditional data. |
| Data | Use to include data from a connection in your report. |
| Image | Use to include images from various sources and locations. |
| Grid | Use to define the layout of a report. A grid can be nested within other grids to support complex layouts. |
| List | Use to display data elements from your data sources that repeat and create a new report row for each data set row. Lists can contain multiple levels of grouping. |
| Table | Use to display repeating data elements within your report. Tables support multiple columns and multiple levels of grouping. |
| Chart | Use to add rich, interactive charting to your BIRT report. |
| Cross Tab | Use to display grouped and dynamic data, organized by both the row and column level. |
| Aggregation | Use to build totals for tables and groups. Includes over 30 built-in functions including COUNT, SUM, MAX, MIN, AVE, RUNNINGSUM, COUNTDISTINCT and RANK. |
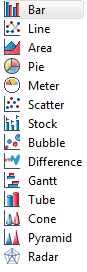
Chart Types
The chart types you’ll find out-of-the-box with BIRT are shown below. Several of the charts are offered in 2D, 2D with depth and 3D formats. Most charts also have more than one sub-type, such as a bar chart with options of side-by-side, stacked and percent stacked, or a stock chart with options of candlestick and bar-stick. If you don’t find what you’re looking for, you can create a custom chart plug-in.
Property Editor (7)
Just below the layout window, you’ll find the property editor. This area allows you to customize your design or individual elements with just a few clicks. Options include filtering, grouping, sorting, mapping and highlighting.
Outline (8)
The outline shows your design in a tree structure. You also use the outline view to create and edit master pages, add styles, import CSS formatting, embed images and locate scripts within your design.
Tutorial: Creating a Simple Listing Design
Now that you’ve taken a quick tour of BIRT Designer, let’s build a very simple design. This tutorial assumes you’ve already installed BIRT and are in the Report Design perspective.
- Right click in the Navigator and create a new Project by selecting Report Project under Business Intelligence and Reporting Tools. Enter a name for your project and hit Finish.
- Right click on your new project in the Navigator and create a new report. Be sure your project is selected, give the design a name and hit Next. Here you’ll have several template options for getting started. As stated above in the BIRT Files list, you can create your own templates to add to this list. Choose the blank template and hit Finish.
- Go to the Data Explorer, right-click on Data Sources and create a new data source. Choose the Classic Models database, give your Data Source a
name and hit Finish. Next, right-click on Data Sets and create a new data set. Make sure your data source is selected, give your data set a name
and hit Next. Enter the following query, then hit Finish:
select * from payments
Click Preview Results, then click OK. - Drag a Label from the Palette into the layout window and enter My First Report. Drag your data set from the Data Explorer into your layout, below the label. Select all of the columns in the pop-up and click OK.
- Select the table in the layout by hovering over the lower-left corner of the table and selecting the “Table” tab. You’ll notice the Property Editor changes to reflect the fact that you’re working on a table. Go to the Groups tab in the property editor and select Add. Name your group, then select CUSTOMERNUMBER from the Group On drop-down menu. Hit OK and delete the CUSTOMERNUMBER data element from the detail row (not the group header). Go to Run -> View Report -> In Web Viewer.
In five short steps, you’ve created a very simple report with a table listing your data. Take some time to explore other options in the property editor, e.g., add a chart, or add a CSS style. You’ll see how quickly you can take this simple design to the next level.
Advanced Design Customization
Now that we’ve gone through the basics and you’ve created your first design, it’s time to learn how to customize and personalize your design to fit the needs of your application. Customization, in this case, refers to things like localization, internationalization, styles and scripting.
Localization
BIRT supports internationalization of report data, including support for bidirectional text. BIRT also supports the localization of static report elements within a report, allowing you to replace report labels, table headers and chart titles with localized text. BIRT allows the use of multiple resource files with name/value pairs and a *.properties file extension. For example, a file called MyLocalizedText_de.properties can include a line that says “welcomeMessage=Willkommen”.
To use the properties files within a BIRT report:
| Localization required | Where to set it |
| Assign resource files to entire report | Report ➤ Properties ➤ Resources ➤ Resource Files |
| Assign individual keys to a label | Label ➤ Properties ➤ Localization ➤ Text key |
Styles
Reports created with BIRT Designer can be richly formatted to adapt the look and feel of your existing web application or company color scheme.
| Type of style | How the style is used |
| Built-In Styles | Built-in styles can be shared in a report library for managing style across multiple reports. |
| CSS | BIRT can import CSS files at design time or reference existing CSS files at run time. |
I have collected some examples of CSS styles here.
Customization with Expressions, Scripting and Events
You can modify many aspects of reports in BIRT Designer using drag-and-drop capabilities and by setting properties, but the designer also supports more advanced customizations through expressions, scripting and events.
The expression builder in BIRT allows you to do conditional report processing instead of hard coding values. For example, the expression below will include the ADDRESSLINE2 field in an address if it’s not null.
if (dataSetRow[“ADDRESSLINE2”] == nulll) {
dataSetRow[“ADDRESSLINE1”] + “, “ + dataSetRow[“CITY”] + “, “ + dataSetRow[“STATE”] + “ “ + dataSetRow[“POSTALCODE”];
} else {
dataSetRow[“ADDRESSLINE1”] + “ “ + dataSetRow[“ADDRESSLINE2”] + “, “ + dataSetRow[“CITY”] + “, “ + dataSetRow[“STATE”] + “ “ +
dataSetRow[“POSTALCODE”];
}
Scripting of BIRT content can be done in either JavaScript or Java. You can add scripting to report object, data source and data element event types. Each of these event types has several events that you can overwrite. I have collected a variety of sample scripts here.
You can also use head.js() in the report’s clientScripts method to load external JavaScript libraries for use on the client side. For an example on this, see this blog post.
BIRT Deployment Options
Now that you’ve created your designs, you’re ready to deploy them. There are several different ways to generate the output. You can run these designs directly from the BIRT Designer, or generate them from your Java application using the BIRT APIs.
BIRT Runtime Engine
BIRT supplies several APIs and an example Java EE application for generating and viewing reports. The major APIs are the Design Engine API (DEAPI), Report Engine API (REAPI) and the Chart Engine API (CEAPI). In addition to the APIs, BIRT supports scripting using either Java or JavaScript within report designs.
| API name | How to use it |
| Design Engine API (DEAPI) | Use the DEAPI to create a custom report designer tool, or to explore or modify BIRT report designs. The BIRT Designer uses this API. You can call this API within a BIRT script to modify the currently running report design. |
| Report Engine API (REAPI) | Use the REAPI to run BIRT reports directly from Java code or to create a custom web application front end for BIRT. |
| Chart Engine API (CEAPI) | Use the CEAPI with other Java or Web applications to render charts directly (i.e., not inside of the BIRT Runtime). CEAPI can also be used within the BIRT Runtime. |
To see API examples, visit http://developer.actuate.com/community/devshare and perform a search for “API.”
BIRT Report Engine Tasks
There are several tasks supplied by the REAPI that can be used to generate report output. A few key tasks are listed below.
| Class | How to use it |
| IRunAndRenderTask | Use this task to run a report and create output directly to a supported format. This task does not create a report document. |
| IRunTask | Use this task to run a report and generate a report document that can be saved to disk. |
| IRenderTask | Use this task to render a report document created in the IRunTask to a specific format, such as HTML or PDF. |
| IGetParameterDefinitionTask | Use this task to create your own parameter GUI and obtain information about parameters, including default values. |
| IDataExtractionTask | Use this task to extract data from a report document. The BIRT Web Viewer uses this class to extract report data into CSV format. |
Example of BIRT Runtime Engine
With some simple code you can start up the BIRT Runtime Engine and Platform, create a task to accept the parameter value, generate and render the design to PDF, then destroy the engine and shut down the platform when finished. I have collected sample code to do that here. In an actual application, you’d want to separate the BIRT Runtime Engine and Platform code and only shut them down when you terminate your application.
Web Viewer
The BIRT Web Viewer is an example application that illustrates generating and rendering BIRT design outputs in a web application. This viewer demonstrates report pagination, an integrated table of contents, report export to several formats and printing to local and server side printers.
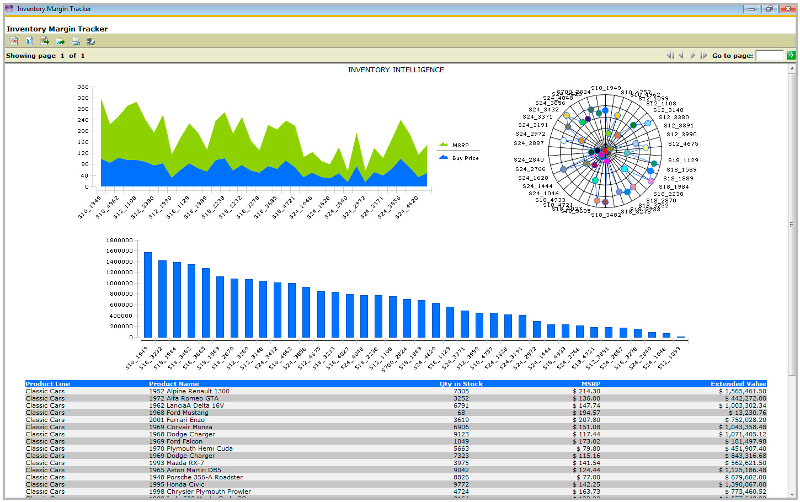
BIRT Web Viewer
The BIRT Web Viewer can be used in a variety of ways:
| Use for the viewer | How it’s used |
| Standalone (Example Viewer) | Use as a pre-built web application, for running and viewing static reports, that doesn’t require security. |
| Modify Viewer source | Use as a starter web application, customizing it for your environment. |
| RCP application | Use as a plug-in for your existing RCP application. |
| Integrated with existing web application | Integrate using URLs or BIRT JSP tag library. |
The BIRT Web Viewer consists of two main Servlets: the ViewerServlet and the BirtEngineServlet. These Servlets handle three mappings: (/frameset, /run and /preview).
| Servlet mapping | What it does, how it’s used |
| /frameset | Renders the report in the full AJAX viewer, complete with toolbar, navigation bar and table of contents. This mapping also generates an intermediate report document from the report design file to support the AJAX-based features. For example, http://localhost:8080/viewer/frameset?__report=myreport.rptdesign&parm1=value. |
| /run | Runs and renders the report but does not create a report document. This mapping does not supply HTML pagination, table or contents, or toolbar features, but it does use the AJAX framework to collect parameters, support report cancelling and retrieve the report output in HTML format. For example, http://localhost:8080/viewer/run?__report=myreport.rptdesign&parm1=value. |
| /preview | Runs and renders the report but does not generate a report document, although an existing report document can be used (in which case just the render operation occurs). The output from the run and render operation is sent directly to the browser. For example, http://localhost:8080/viewer/preview?__report=myreport.rptdesign&parm1=value. |
Other BIRT Web Viewer Settings
Many URL parameters can be used with the Servlet mappings. The BIRT Web Viewer itself has several key settings that can be configured by modifying the web.xml file located in the WebViewerExample/WEB-INF folder. The BIRT Web Viewer also includes a set of JSP tags, available from the BIRT Web Tools Integration download, that make it easy to integrate BIRT reports into browser pages. All of these options are described in the BIRT Web Viewer documentation here: https://eclipse.org/birt/documentation/integrating/viewer-usage.php.
BIRT Output Formats
In addition to delivering paginated report content to a web browser, BIRT also supports several other output formats. These formats listed below are supported by both the Report Engine API as well as the BIRT Web Viewer.
| Output type | What it means |
| Paginated HTML output | An example web viewer is included with BIRT, allowing for on-demand paginated web output. |
| Microsoft Office | Word, Excel and PowerPoint. |
| HTML | Suitable for creating HTML pages of report data that can be deployed to any server. |
| Adobe PDF output suitable for emailing or printing. | |
| Postscript | Output that can be directed to a Postscript-compatible printer. |
| Open Document | Text, spreadsheet and presentation. |
BIRT Extension Points
The APIs in BIRT define extension points that let the developer add custom functionality to the BIRT framework. These extensions can be in the form of custom data sources, report items, chart types, output formats and functions. Once implemented, these custom extensions will show along with the built-in types. For example, you can create a custom report item, like a rotated text label, that will show up in the BIRT Palette along with the existing items. Below are some of the most used extension points.
| Extension point | How it’s supported |
| Data Sources | BIRT supports the Eclipse Open Data Access (ODA) architecture, which means it can be extended to support custom data sources. |
| Functions | BIRT allows you to create custom functions that extend the functions available in BIRT Expressions. |
| Report Items | Report Items can be extended, allowing you to create your own custom report items. |
| Chart Types | Additional chart types can be added to BIRT as plug-ins. |
| Output Emitters | BIRT can be extended to include your own custom output type. For example, a simple CSV emitter can be added to BIRT. |
BIRT Resources
About the Authors