Eclipse Web Tools Platform 3.2 M7 - New and Noteworthy | Back |
JSDT
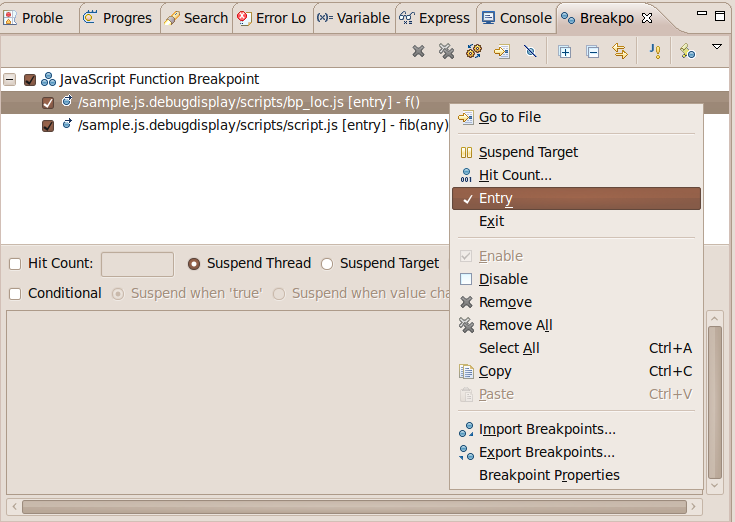
Quick Access to Breakpoint Properties
Breakpoint properties are now quickly accessible via the context menu in the Breakpoints View (to better match JDT breakpoint support).
Breakpoint Condition Content Assist
Content Assist is now available in the breakpoint condition editor.

Rhino Console
When wanting to test Rhino, or work from a command line interface, we have provided the Rhino debug console.
Our Rhino console allows access to all of the Mozilla Rhino shell tools as described
here. Our shell replacement can be run using the
org.eclipse.wst.jsdt.debug.rhino.debugger.shell.DebugShell class from the
org.eclipse.wst.jsdt.debug.rhino.debugger project.

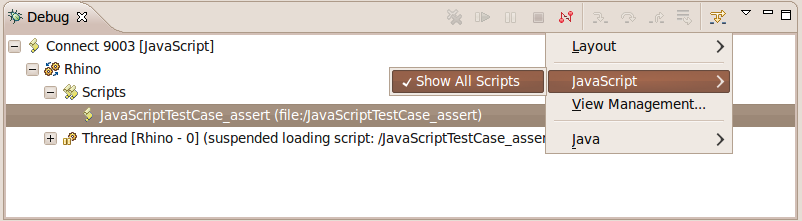
Show All Scripts
In the Debug View you can view all of the scripts currently loaded in the the running debug target.
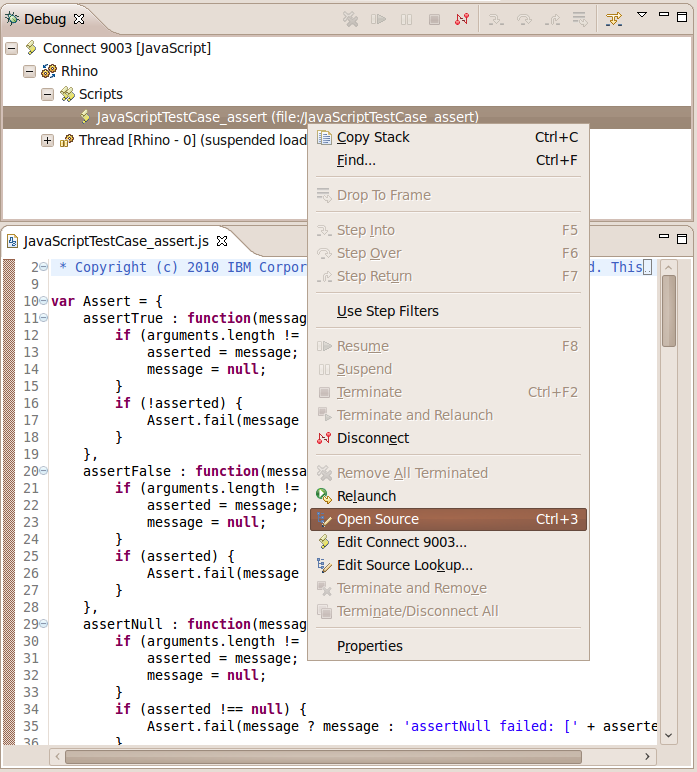
Open Source (Ctrl + 3)
When showing all scripts you can also load the source for any scripts that has been loaded at any given time. To do so we have provided the Open Source command available in the Debug View (Ctrl + 3).
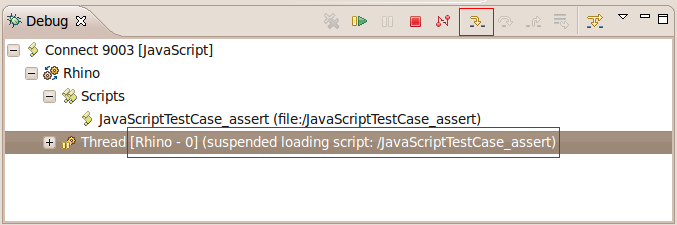
Step Into Script Load
With our existing support to suspend execution when a (or any) script loads it was not clear to the user what could happen next. We have added support to be able to step into the first executable line of the the loaded script (as well as resume execution like before). Also the suspended message on the thread now gives a very clear message why you are suspended.