Eclipse Web Tools Platform 3.2 M6 - New and Noteworthy | Back |
XML
Full XML Catalog Preferences
- Rewrite entries (where a starting prefix is exchanged for another)
- Suffix matching
- Delegate catalogs (i.e. catalogs included if the URI being sought after matches a given prefix)

The XML Catalog page now supports creating all kinds of XML catalog elements, notably:
Thanks to Holger Voormann for the icons!
Quick Outline
The XML editor provides a Quick Outline that has a filterable set of elements. Selecting an element from the quick outline will highlight the corresponding element in the source editor.

Paged Content Assist Cycling
Content assist in the XML editor now has multiple pages. This new functionality creates an identical user experience to that of Java editors. The default, or first page, of content assist still displays the same results, by default, as the old content assist did but subsequent invocations of content assist will display different pages of content assist suggestions.

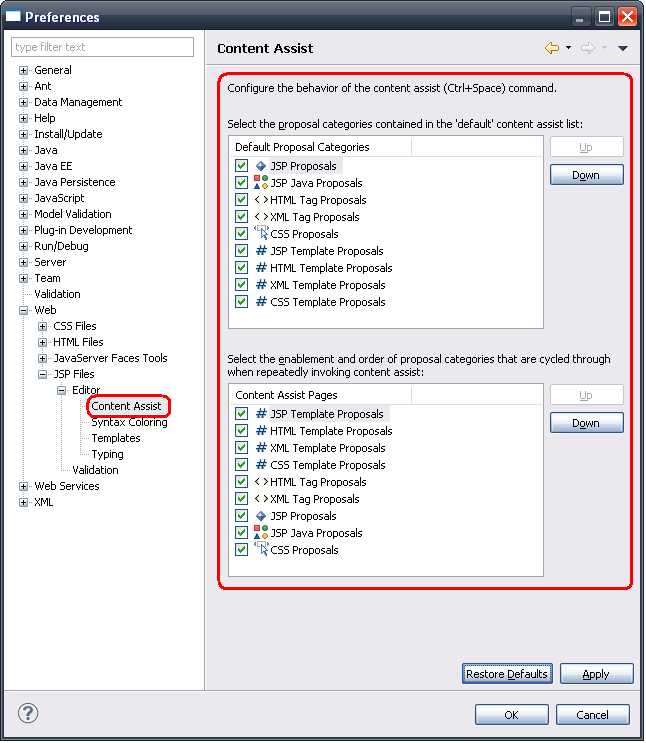
The order in which results are displayed on the default content assist page and the order in which subsequent pages are displayed are user configurable through a new preference page.

HTML
Quick Outline
The HTML editor provides a Quick Outline that has a filterable set of elements. Selecting an element from the quick outline will highlight the corresponding element in the source editor.

Paged Content Assist Cycling
Content assist in the HTML editor now has multiple pages. This new functionality creates an identical user experience to that of Java editors. The default, or first page, of content assist still displays the same results, by default, as the old content assist did but subsequent invocations of content assist will display different pages of content assist suggestions.

The order in which results are displayed on the default content assist page and the order in which subsequent pages are displayed are user configurable through a new preference page.

JSP
Quick Outline
The JSP editor provides a Quick Outline that has a filterable set of elements. Selecting an element from the quick outline will highlight the corresponding element in the source editor.

Paged Content Assist Cycling
Content assist in the JSP editor now has multiple pages. This new functionality creates an identical user experience to that of Java editors. The default, or first page, of content assist still displays the same results, by default, as the old content assist did but subsequent invocations of content assist will display different pages of content assist suggestions.

The order in which results are displayed on the default content assist page and the order in which subsequent pages are displayed are user configurable through a new preference page.
CSS
Quick Outline
The CSS editor provides a Quick Outline that has a filterable set of elements. Selecting an element from the quick outline will highlight the corresponding element in the source editor.

JSDT Debug
JSDI API
org.eclipse.wst.jsdt.debug.core.jsdi- which contains the core JSDI descriptions for debug elements and JavaScript valuesorg.eclipse.wst.jsdt.debug.core.jsdi.connect- which contains descriptions of debug client connectors that are used to plug into the core launching frameworkorg.eclipse.wst.jsdt.debug.core.jsdi.event- which contains descriptions of all of the events JSDI handles while debuggingorg.eclipse.wst.jsdt.debug.core.jsdi.request- which contains descriptions of all of the kinds of requests that can be sent using JSDI
The JavaScript Debug Interface (JSDI) is an API that consumers can implement to hook into the use of the debug core and UI bundles. Implementing SDI for a particular scenario allows consumers to take advantage of the debug model and UI for free
JSDI is provided as new API in the /org.eclipse.wst.jsdt.debug.core bundle in the packages:
Breakpoint Participants
Breakpoint participants can be contributed by consumers to take part in the suspension of any of the supported
breakpoint types (function, line or script load). They can be provided via the org.eclipse.wst.jsdt.debug.core.breakpointParticipants
extension point.
Rhino provides an implementation that participates in the suspension of all breakpoint types:
	<extension point="org.eclipse.wst.jsdt.debug.core.breakpointParticipants">
	  <participant
	     class="org.eclipse.wst.jsdt.debug.internal.rhino.breakpoints.RhinoBreakpointParticipant"
	     kind="*">
	  </participant>
	</extension>
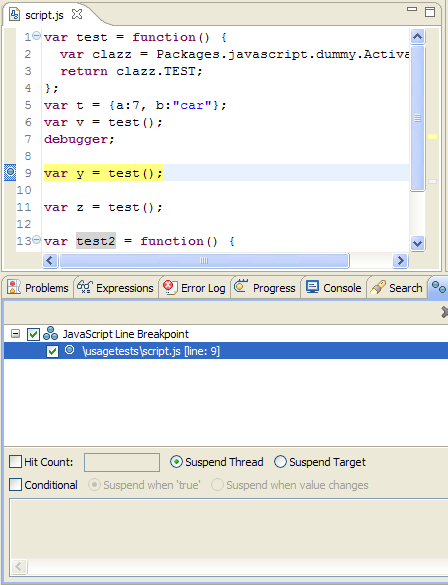
Line Breakpoints
Like any other, the JavaScript debugger provides line breakpoints. These can be set using the standard methods such as toggling in the editor, from the outline view or using Ctrl+Shift+B in source.
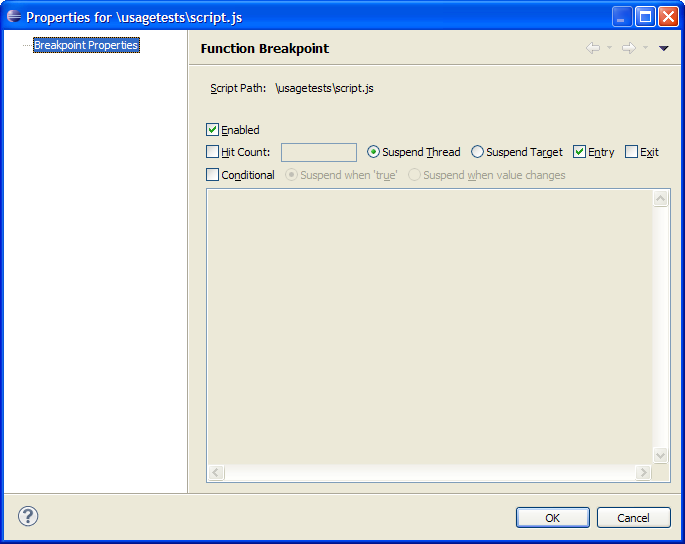
Function Breakpoints
Function breakpoints are supported similarly to JDT, where you can suspend on entry or exit from a function. These can be set using the standard methods such as toggling in the editor, from the outline view or using Ctrl+Shift+B in source.

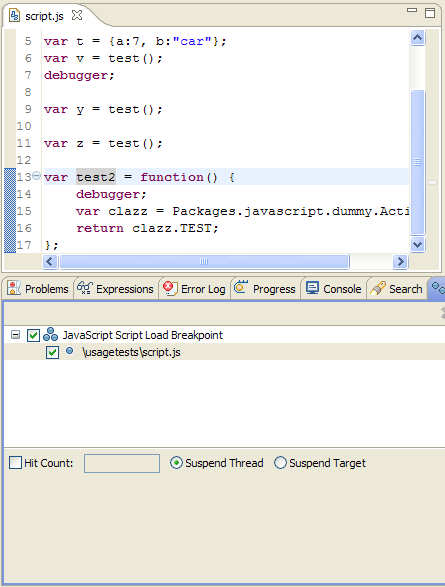
Script Load Breakpoints
Script load breakpoints can be set per JavaScript to suspend execution when that particular script is loaded. This feature provided by a toolbar action in the Breakpoints View.
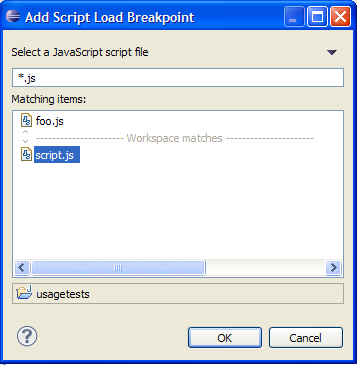
Example of a script load breakpoint
Breakpoint Detail Panes
For each of the breakpoint types we support there are accompanying details panes for the new Breakpoints View. Each detail pane allows you to quickly make changes to that kind of breakpoint.

Breakpoint Properties
Each breakpoint type has its own properties page that is opened via the Breakpoint View using the standard Alt+Enter key binding or the context menu.
Suspend when any script loads
- An evaluated script loads and you want to be able to step through it during the evaluation
- You are trying to find our what scripts are loaded in what order
- You are trying to find a particular script and don't know its name or have it in your workspace
Even with support to suspend when a particular script loads, it is extremely useful to be able to know when any given script loads. This is particularly useful for know when:

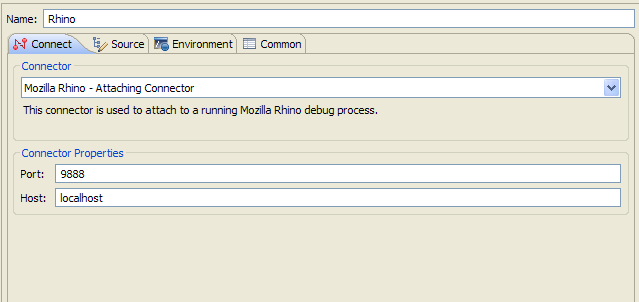
Universal Launching Support
To support remote debugging we support a reusable UI that consumers get for free when they provide a JSDI launching connector.
The following example is the UI for Rhino launching connector.
Watch Expressions
Watch expressions can be added to a debug session in the same manner as JDT. They are re-evaluated after stepping operations and are persisted across workbench invocations.

Rhino Debug Support
- A Rhino launching connector
- A Rhino debug client to enable remote debugging
- Source lookup
- Breakpoint participants
- The Rhino console
JSDT Debug provides a base implementation of JSDI in the form of Rhino debug support. This support includes: