Eclipse TRACE4CPS™ is a customizable, domain-independent and source-independent Gantt chart viewer with mathematically-founded analysis support. Eclipse TRACE4CPS™ supports the visualization of activities on resources as a function of time (Gantt charts), as well as the visualization of continuous signals. Eclipse TRACE4CPS™ also supports several analysis techniques to identify bottlenecks, check formally-specified (performance) properties, and analyze resource usage. A key feature of Eclipse TRACE4CPS™ is the ability to configure the identification, selection and visualization of such information to match any specific application domain.
|
The Eclipse TRACE4CPS™ project is currently in the Incubation Phase. 
|
Visualization and analysis of concurrent system activities
Eclipse TRACE4CPS™ helps us to understand complicated behavior over time for all kinds of systems through its domain-independent capabilities for visualizing and analyzing concurrent activities that are encoded in execution traces. Eclipse TRACE4CPS™ supports claims on resources, events, dependencies, and continuous signals.
Figure 1 shows a typical Eclipse TRACE4CPS™ Gantt chart of an application that iteratively executes activities A-G. The claims model executions of these system activities and are shown as colored rectangles with a start and end time. Data flow between the activities is modeled by dependencies between claims, shown as arrows between the claims. Events, such as the start and end of an iteration of the application, are shown at the bottom as vertical arrows. The signal, above the events and below the claims, shows the throughput of the modeled system.

Understanding system behavior over time
There are many reasons why a system’s behavior over time is difficult to understand or, worse, confusing – even when the system is performing as designed. An example is a situation in which many concurrent activities share resources. Unforeseen interactions may arise due to the specific timing of the activities. Moreover, if the timing of the activities changes (e.g. due to an upgrade to the computational platform), the interactions may also change, which could result in significantly different behavior. Insight into the hows and whys of a system’s behavior over time is of paramount importance for making effective (design) choices and trade-offs in all phases of the system lifecycle, from the design of a new system to the maintenance of an old legacy system. Eclipse TRACE4CPS™ can help with this.
Execution traces to capture behavior over time
Eclipse TRACE4CPS™ works with execution traces. These capture (a single) system behavior over time. An execution trace contains time-stamped data for claims, events and signals. Eclipse TRACE4CPS™ extends this with concepts from the Y-chart paradigm and a number of user-defined attributes (e.g. the name of the activity) in order to be tailored to a specific problem domain. This execution trace concept is generic, which makes Eclipse TRACE4CPS™ widely applicable:
- All levels of abstraction
-
The trace format can capture all levels of abstraction, from low-level embedded activities to system-level activities.
- Domain-independent
-
The trace format is domain-independent but nevertheless has the means to be tailored to a specific domain via the user-defined attributes.
- Source-independent
-
Eclipse TRACE4CPS™ input can be created from any source, e.g. from the log files of legacy systems or from a discrete-event simulation model.
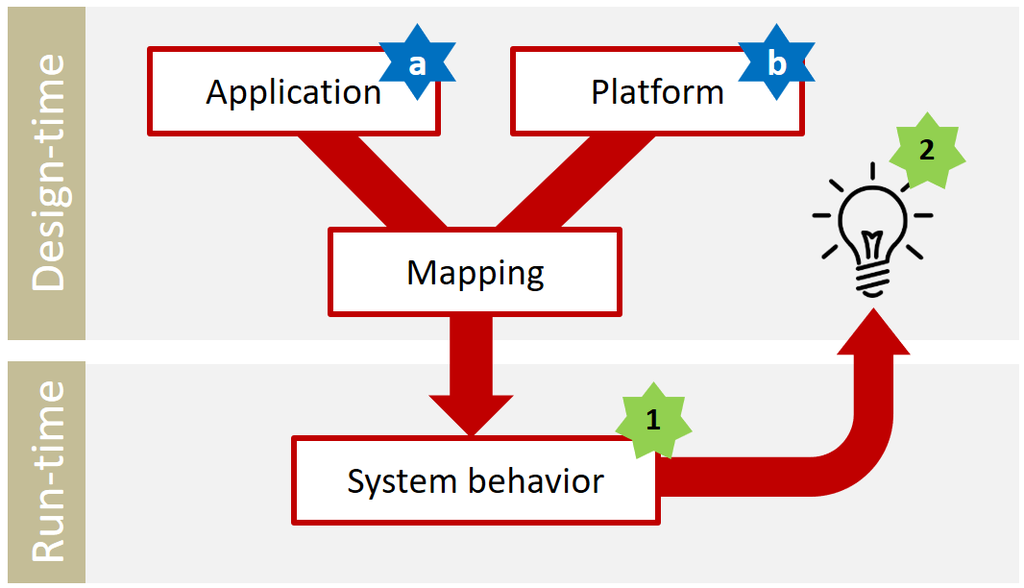
The Y-chart paradigm decomposes a system into an application, a platform, and the mapping between them, fostering reuse when one of these parts changes. Furthermore, it defines a feedback cycle to allow systematic design-space exploration (Figure 2). The Y-chart concepts of application, mapping and platform are realized in Eclipse TRACE4CPS™ through the decomposition of an activity (e.g. an image-processing computation) into one or more claims on resources for a certain amount of time (e.g. two cores of the CPU and 20 MB of RAM for 50 ms). These are the main elements of the execution traces that capture system behavior (star-1 in Figure 2). To provide feedback on the system under analysis (star-2 in Figure 2), Eclipse TRACE4CPS™ provides extensive visualization and analysis of execution traces.
Visualization and analysis of execution traces
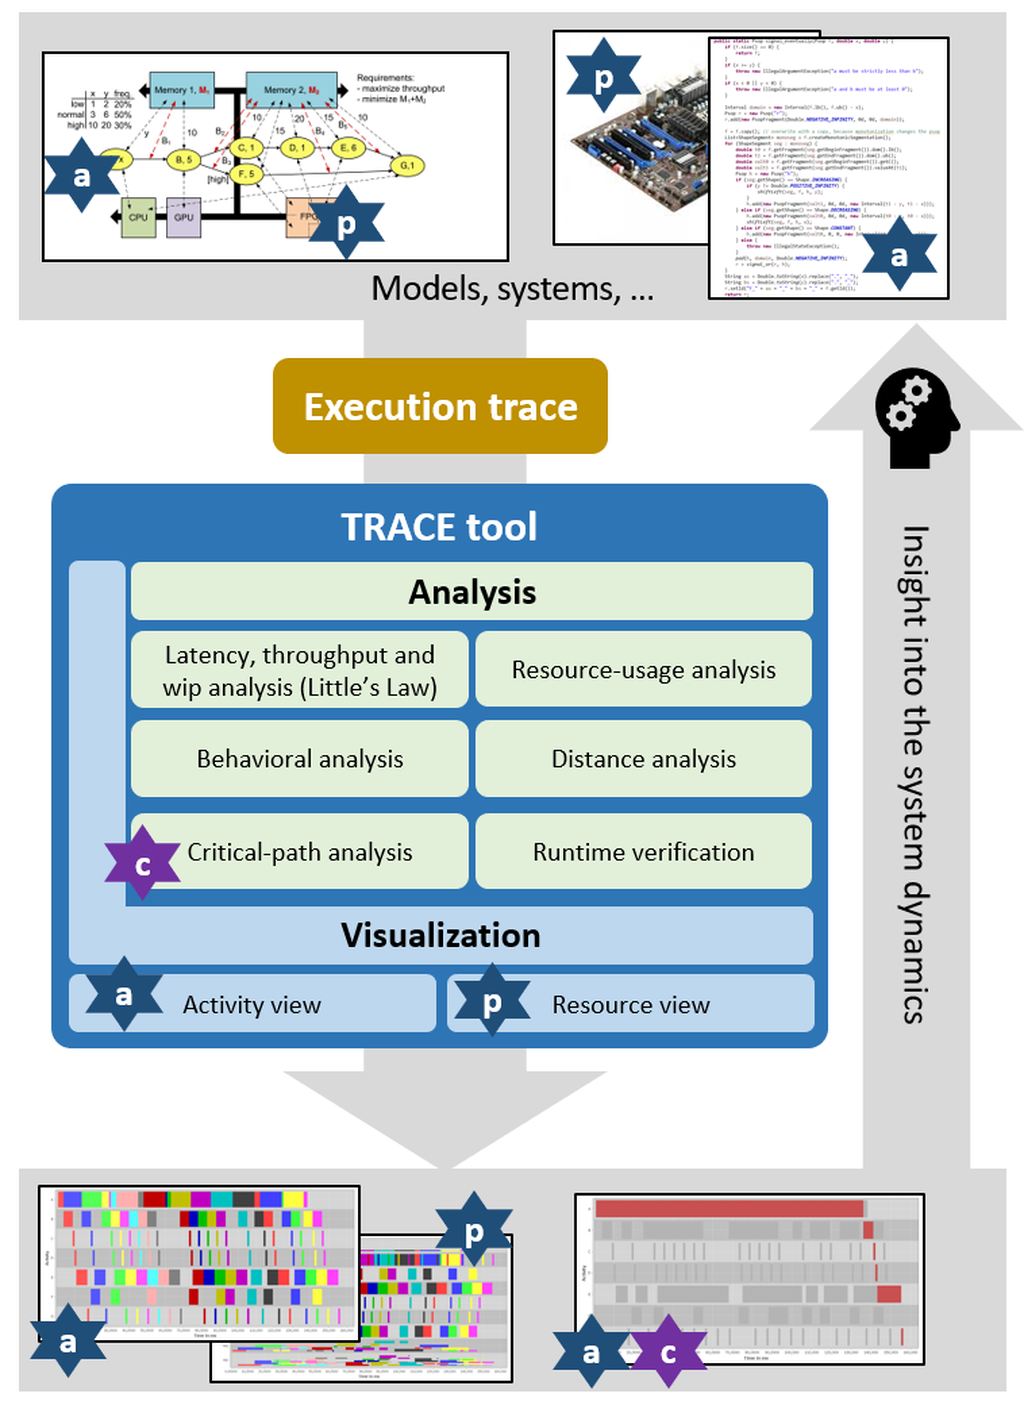
Eclipse TRACE4CPS™ provides insights into the system dynamics of all kinds of systems through the visualization and analysis of execution traces (Figure 3). Eclipse TRACE4CPS™' Gantt chart view offers coloring, grouping and filtering options. This visualization alone is already very powerful and can bring quick insights into the system dynamics. Eclipse TRACE4CPS™ also provides several analysis methods, which sets it apart from other Gantt-chart visualization tools.
- Critical-path analysis
-
Can be used to detect activities and resources that are bottlenecks for performance.
- Distance analysis
-
Can be used to compare execution traces with respect to structure, e.g. to check a model trace against an implementation trace.
- Runtime verification
-
Provides a means to formally specify and verify the properties of execution traces using temporal logic. It is useful for expressing and checking performance properties, e.g., “the processing latency is at most 50 ms.”
- Latency, throughput and work-in-progress analysis
-
Provides built-in methods to derive these properties from an execution trace.
- Behavioral analysis
-
Can be used to visualize repetitive patterns that often are present in systems such as image-processing pipelines and manufacturing machines.
- Resource-usage analysis
-
Can quickly give insights into the details of the resource usage.
Eclipse TRACE4CPS™ and the underlying concepts are relatively easy to learn, the trace input is easy to use, and the application of Eclipse TRACE4CPS™ has great potential benefits.
Installation of Eclipse TRACE4CPS™
The Eclipse TRACE4CPS™ P2 update site contains all plugins and features, for easy integration into OSGi-based applications.
Eclipse TRACE4CPS™ v0.2 is available as an Eclipse P2 update site:
https://download.eclipse.org/trace4cps/v0.2/update-site/
|
Can’t wait for the next release? A nightly build of this page is also available, it is built from the develop branch. Please note that APIs, syntaxes and/or functionality might not be stable for nightly builds. |
Below are instructions to install Eclipse TRACE4CPS™ from scratch.
The first step is to install the Eclipse IDE:
-
Install a 64-bit Java 1.8.
-
Download an Eclipse IDE version 2020-06, e.g., https://www.eclipse.org/downloads/packages/release/2020-06/r/eclipse-ide-java-developers
-
Unzip the IDE, e.g., to the directory
trace. -
Start the Eclipse IDE via
trace/eclipse/eclipse.exe. -
Select a workspace directory: Use the browse button and create a directory, e.g., “trace/workspace”.
-
Close the Welcome tab.
The second step is to install the Eclipse TRACE4CPS™ feature:
-
Select
-
Click Add and put a name (e.g., “Eclipse TRACE4CPS™ update site”) and location:
https://download.eclipse.org/trace4cps/v0.2/update-site/ -
Click OK and check that the window now shows the Eclipse TRACE4CPS™ category.
-
Expand the Eclipse TRACE4CPS™ category, and select the Eclipse TRACE4CPS™ feature and click Next.
-
Complete the remaining steps of the installation process (including acceptance of the license agreement and a restart of the Eclipse IDE).
Installation of the examples
-
Download the trace examples zip file from this site or from the Eclipse help pages following the sub-steps below.
-
Open the Help menu via .
-
Navigate to the Eclipse TRACE4CPS™ user manual, and select the “Running example” section.
-
At the bottom of the page is a link to download a zip file with examples.
-
-
Unzip the trace examples file in the “Eclipse TRACE4CPS™” directory (ensure that a directory is created with a number of
*.etffiles). -
Start the new project wizard from the menu
-
Select “General → Project” in the tree and click “Next”.
-
Choose a project name, e.g., “trace examples”, uncheck the “use default location” option, and use the Browse… button to select the directory with the unzipped example content.
-
Finally, click Finish.
Verify that the “Package Explorer” view now shows the contents of the zip file.
Double-click reference.etf and check whether a Gantt-chart view is shown.
If this is the case, then installation has been successful.
Learn more
If you want to learn more, then read the Eclipse TRACE4CPS™ user manual. It describes the input format of Eclipse TRACE4CPS™ and contains an explanation of the visualization and analysis features. Furthermore, it contains a zip file with example traces.
| Once the Eclipse TRACE4CPS™ feature is installed, the Eclipse Help menu also contains this user manual. |
-
M. Hendriks, T. Basten, “Performance engineering with Eclipse TRACE4CPS™”, Bits & Chips 5, 14 September 2018. https://bits-chips.nl/artikel/performance-engineering-with-trace/
-
M. Hendriks, F.W. Vaandrager. “Reconstructing Critical Paths from Execution Traces”, CSE '12 Proceedings of the 2012 IEEE 15th International Conference on Computational Science and Engineering. IEEE Computer Society Washington, 2012. doi:10.1109/ICCSE.2012.78
-
M. Hendriks, M. Geilen, A.R.B. Behrouzian, T. Basten, H. Alizadeh, and D. Goswami. “Checking metric temporal logic with Eclipse TRACE4CPS™”, in 16th International Conference on Application of Concurrency to System Design (ACSD 2016), Torun, Poland, 2016. doi: 10.1109/ACSD.2016.13
-
M. Hendriks, J. Verriet, T. Basten, B. Theelen, M. Brassé, and L. Somers, “Analyzing execution traces: critical-path analysis and distance analysis”, International Journal on Software Tools for Technology Transfer, 2016. doi:10.1007/s10009-016-0436-z
Eclipse TRACE4CPS™ release notes
The release notes of Eclipse TRACE4CPS™ are listed below, in reverse chronological order.
Version 0.2 (2024-01-22)
The second release of the Eclipse TRACE4CPS™ project, mainly containing bugfixes, but also adds some additional functionality in its common libraries.
For a detailed list of included issues, see https://gitlab.eclipse.org/eclipse/trace4cps/trace4cps/-/milestones/2
Version 0.1 (2022-06-17)
The first release of the Eclipse TRACE4CPS™ project. This version is a port of ESI TRACE v2.0 that is prepared for its release to the Eclipse foundation.
Legal
The material in this documentation is Copyright (c) 2021, 2024 Contributors to the Eclipse Foundation.
Eclipse TRACE4CPS™ and TRACE4CPS™ are trademarks of the Eclipse Foundation. Eclipse, and the Eclipse Logo are registered trademarks of the Eclipse Foundation. Other names may be trademarks of their respective owners.
License
The Eclipse Foundation makes available all content in this document ("Content"). Unless otherwise indicated below, the Content is provided to you under the terms of the Eclipse Public License 2.0 which is available at https://www.eclipse.org/legal/epl-2.0/ For purposes of the EPL-2.0 License, "Software" will mean the Content.
If you did not receive this Content directly from the Eclipse Foundation, the Content is being redistributed by another party ("Redistributor") and different terms and conditions may apply to your use of any object code in the Content. Check the Redistributor’s license that was provided with the Content. If no such license exists, contact the Redistributor. Unless otherwise indicated below, the terms and conditions of the EPL-2.0 License still apply to any source code in the Content and such source code may be obtained at https://www.eclipse.org.