Layers
A layer is a rectangular region of grid cells. A layer has methods to access its columns, rows, width and height. All layers implement the ILayer interface. A layer can be stacked on top of another layer in order to expose a transformed view of its underlying layer's grid cell structure. Layers are used in this way to encapsulate grid transformation behavior such as hiding and reordering columns.
Columns and rows in a layer are referenced either by position or index:
- The position of a column/row in a layer corresponds to the physical location of the column/row in the current layer. Positions always start from 0 and increase sequentially.
- The index of a column/row in a layer corresponds to the location of the column/row in the lowest level layer in the layer stack. Usually the lowest layer in the layer stack will be the DataLayer. Indexes are not necessarily ordered, and in some cases may not even be unique within a layer.
These concepts are illustrated by the following example:
		ColumnHideShowLayer C
		0 1 2 3 4 <- column positions
		1 0 3 4 5 <- column indexes


		ColumnReorderLayer B
		0 1 2 3 4 5 <- column positions
		2 1 0 3 4 5 <- column indexes


		DataLayer A
		0 1 2 3 4 5 <- column positions
		0 1 2 3 4 5 <- column indexes
In the above example, ColumnHideShowLayer C is stacked on top of ColumnReorderLayer B, which is in turn stacked on top of DataLayer A. The positions in DataLayer A are the same as its indexes, because it is the lowest level layer in the stack. ColumnReorderLayer B reorders column 0 of its underlying layer (DataLayer A) after column 2 of its underlying layer. ColumnHideShowLayer C hides the first column of its underlying layer (ColumnReorderLayer B).
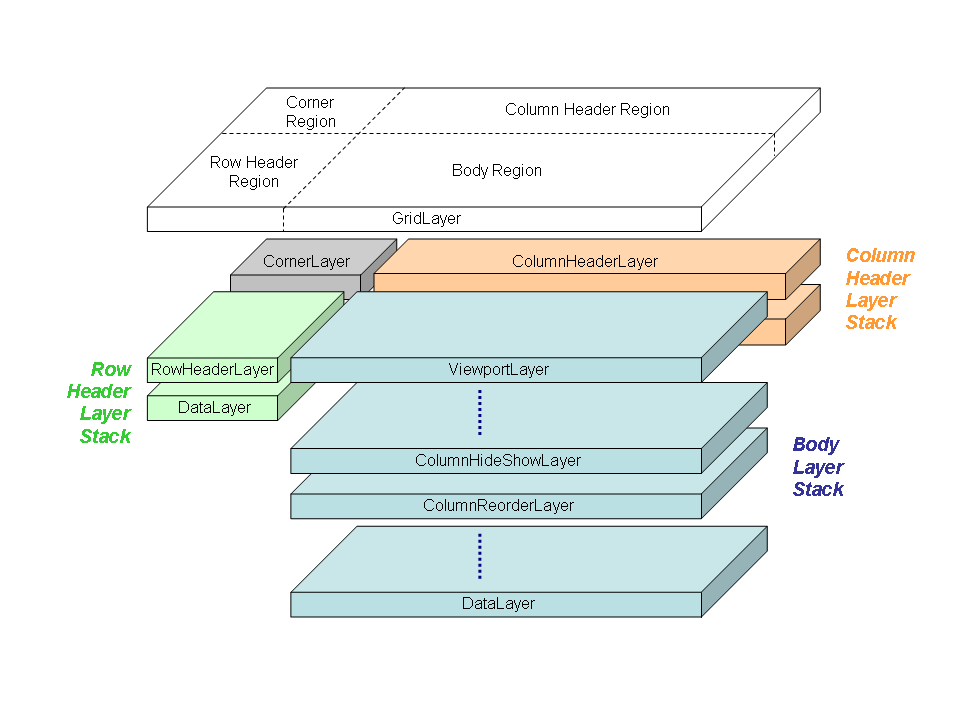
Layers can also be laterally composed into larger layers. For instance, the GridLayer is composed of several layers/layer stacks for every region.
Following you will find the existing layers in NatTable:
BlinkLayer
ColumnGroupExpandCollapseLayer
ColumnGroupGroupHeaderLayer
ColumnGroupHeaderLayer
ColumnGroupReorderLayer
ColumnHeaderLayer
type: DimensionallyDependentLayer
ColumnHideShowLayer
ColumnReorderLayer
CompositeFreezeLayer
type: CompositeLayer
CornerLayer
DataLayer
The primary purpose of the DataLayer is to attach the IDataProvider to the table and supply data for the cells. It also handles resize commands and tracks column/row sizes via SizeConfig objects. This layer always works with column/row indexes i.e the position of the cell in the underlying data source. It is usually the lowermost layer in a layer stack.
The following specializations of the DataLayer exist:
- DefaultColumnHeaderDataLayer
Specialization of a DataLayer for the column header of a grid. Sets the size of the cells to width 100 and height 20 by default. - DefaultRowHeaderDataLayer
Specialization of a DataLayer for the row header of a grid. Sets the size of the cells to height 40 and width 40 by default. - FilterRowDataLayer
Needed for the filter row of a NatTable. Will handle filter commands, adds special filter row labels to filter row cells and provides constants that are needed to customize the filter row. It is not intended to use the FilterRowDataLayer itself. - GroupByDataLayer
... - SpanningDataLayer
...
FilterRowHeaderComposite
...
type: CompositeLayer uses FilterRowDataLayer
FreezeLayer
GlazedListsEventLayer
GridLayer
This is a top level layer used to divide up the table into grid regions. A layer or layer stack can then be assigned to each of these regions. This layer mostly serves to delegate functions to its lower layers.
There is a default implementation DefaultGridLayer that uses DefaultBodyLayerStack, ColumnHeaderLayer, RowHeaderLayer and CornerLayer which are created out of the data information given to one of the constructors.
GroupByHeaderLayer
type: DimensionallyDependentLayer
RowGroupHeaderLayer
RowHeaderLayer
type: DimensionallyDependentLayer
SelectionLayer
Enables selection of rows, columns or cells on the table. Adds keyboard / mouse configuration used to trigger selection and style configuration for special rendering of selection. Also hooks in the search and the tick update features. Uses the SelectionModel internally to track the selection state.
The SelectionLayer is part of the body region layer stack of a grid, but will be referenced by all other regions layer stacks. You can find further information on the SelectionLayer here.
SortHeaderLayer
SummaryRowLayer
NatTable supports adding a summary row to the table composition. For this the SummaryRowLayer needs to be added to the layer stack. Typically it should be set on top of the DataLayer or at least before other layers are added to the layer stack that are able to transform indexes and positions.
Adding the SummaryRowLayer to the body layer stack
If your NatTable is composed as a grid you should also consider using the DefaultSummaryRowHeaderDataProvider for your row header layer stack. This is necessary because the SummaryRowLayer adds a row to the body, therefore the row header also needs to add an additional row.
As you can see in the example above, it is necessary to provide a configuration for the SummaryRowLayer. There is a default configuration available, but using it without modification will simply show ... instead of a calculated summary row value. This is because the SummaryRowLayer does not know about the data model structure and the values that are shown.
To configure the SummaryRowLayer contents, you need to create an ISummaryProvider that knows about the data structure and how to calculate the summary to show. NatTable comes with the SummationSummaryProvider that sums the values in a column if they are of type Number.
Implementing a custom ISummaryProvider is quite straight forward. You simply need to implement the summarize(int) method the way that fits your needs. Usually you need to provide access to the data in some kind of way, either by giving access to the DataLayer or the IDataProvider to your ISummaryProvider.
Implementing a custom ISummaryProvider that calculates the average value in a column
The ISummaryProvider needs to be registered for the SummaryRowConfigAttribute.SUMMARY_PROVIDER config attribute. You can either register the same ISummaryProvider for the whole summary row by using the SummaryRowLayer.DEFAULT_SUMMARY_ROW_CONFIG_LABEL or register a special ISummaryProvider per column by using the SummaryRowLayer.DEFAULT_SUMMARY_COLUMN_CONFIG_LABEL_PREFIX + <column index>
Labels
The SummaryRowLayer automatically adds the following labels to the label stack of the cells in the summary row:
| Label | Description |
|---|---|
| SummaryRowLayer.DEFAULT_SUMMARY_ROW_CONFIG_LABEL | Added to every cell of the summary row. |
| SummaryRowLayer.DEFAULT_SUMMARY_COLUMN_CONFIG_LABEL_PREFIX + <column index> | Added to the summary row cells per column to configure every column cell in the summary row differently. |
Configuration attributes
The following ConfigAttributes are interpreted by the SummaryRowLayer and need to be set in order to make it work correctly:
| ConfigAttribute | Type | Description |
|---|---|---|
| SummaryRowConfigAttributes.SUMMARY_PROVIDER | ISummaryProvider | Configure the ISummaryProvider that should be used to calculate the sum of a column. |
Bindings
The SummaryRowLayer does not add bindings to the NatTable.
Have a look at the DefaultSummaryRowConfiguration for an example summary row configuration.
Commands
| ILayerCommand | Description |
|---|---|
| RowResizeCommand | Executing this command for the summary row index allows resizing the summary row programmatically. |
| CalculateSummaryRowValuesCommand | Executing this command will trigger the synchronous calculation of all summary row values. By default the values will be calculated asynchronously when they are requested the first time. This command is used internally to calculate the values before printing or exporting a NatTable to ensure the values are calculated correctly. |
Note that the CalculateSummaryRowValuesCommand will be introduced with the next NatTable release and is currently only available in the latest development SNAPSHOTs.
Events
| ILayerEvent | Action | Description |
|---|---|---|
| IVisualChangeEvent | handle | For performance reasons the calculated sum values are cached in the SummaryRowLayer. Receiving an IVisualChangeEvent will clear the cache and trigger recalculating the sum values. |
| RowUpdateEvent | fire | As the sum calculation is performed in a separate thread, a RowUpdateEvent is fired when the calculation is done. |