

Eclipse Community Forums
Forum Search:

Search      Help    Register    Login    Home
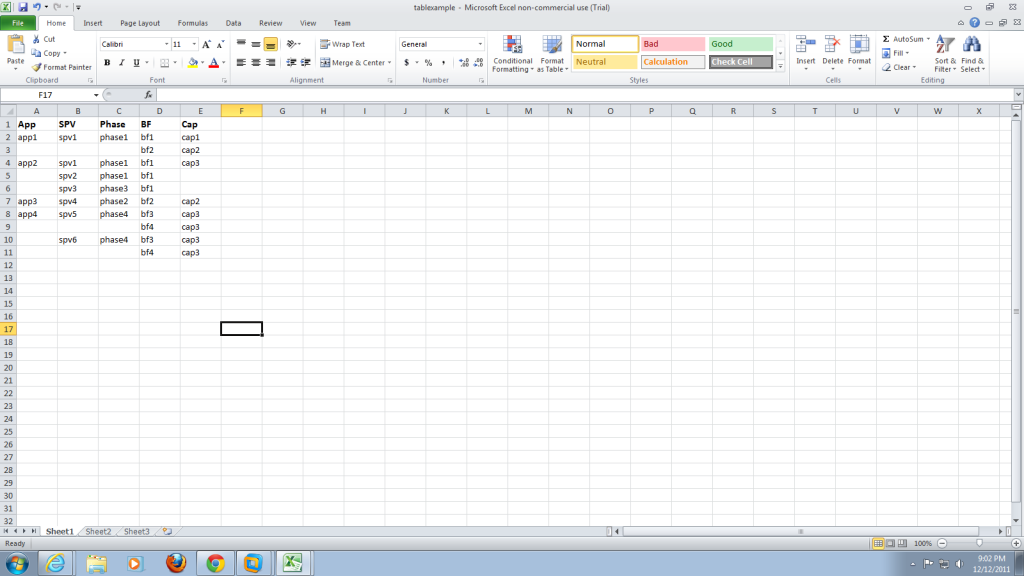
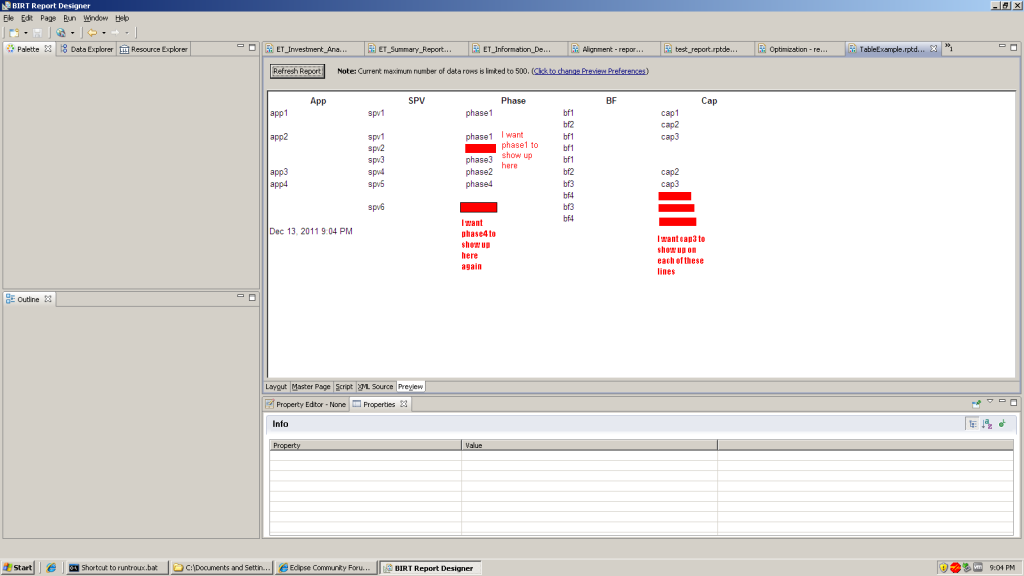
Home » Archived » BIRT » Table grouping help
Table grouping help [message #764871] Tue, 13 December 2011 01:55 Go to next message
Missing name Missing name is currently offline Missing name Missing nameFriend
Messages: 11
Registered: November 2011
Junior Member
I'm somewhat confused with groupings/suppress duplicates/etc.

Here is an example of a table and what a run would look like..as far as groupings and where I don't want duplicates. I'm hoping by seeing something like this I can see how I can make any type of different layout.

I've attached an .xls of what I hope to duplicate. Basically if I had a table with these columns, how could I set the groupings/suppress duplicates to do this? And what would the actual table look like in the GUI?

Here is a screenshot of the .xls if you don't have Excel.
http://i274.photobucket.com/albums/jj265/Erebel55/tablexample-1.png

I appreciate any help. Thanks so much.

[Updated on: Tue, 13 December 2011 02:02]

Report message to a moderator

Re: Table grouping help [message #764912 is a reply to message #764871] Tue, 13 December 2011 04:45 Go to previous messageGo to next message
Missing name Missing name is currently offline Missing name Missing nameFriend
Messages: 11
Registered: November 2011
Junior Member
Here is my attempt at it (not using a sample database, I apologize) but you can get the gist of what my table looks like and it isn't working 100% because it doesn't show the phase per SPV (Underlying technology) but instead shows it per Application. Also if I removed the footer row it shows duplicates in my first column :S

Please help.
Re: Table grouping help [message #765235 is a reply to message #764912] Tue, 13 December 2011 17:14 Go to previous messageGo to next message
Jason Weathersby is currently offline Jason WeathersbyFriend
Messages: 9167
Registered: July 2009
Senior Member

I saved the xls data as csv and created a report against it and used two
groups. Can you have a look at the attached report design and the csv
file I used for data and explain what you need from it?

Jason

On 12/12/2011 11:45 PM, redviper8 wrote:
> Here is my attempt at it (not using a sample database, I apologize) but you can get the gist of what my table looks like and it isn't working 100% because it doesn't show the phase per SPV (Underlying technology) but instead shows it per Application. Also if I removed the footer row it shows duplicates in my first column :S
>
> Please help.
Re: Table grouping help [message #765417 is a reply to message #765235] Wed, 14 December 2011 02:17 Go to previous messageGo to next message
Missing name Missing name is currently offline Missing name Missing nameFriend
Messages: 11
Registered: November 2011
Junior Member
Thank you for showing me how to do this! I've never used .csv before.

I've attached an updating .zip with an updated .csv that will show the problems I have with this report when ran.

Also, here is a screenshot with the problem areas outlined.
http://i274.photobucket.com/albums/jj265/Erebel55/screenshot-6.png

So basically I want the phase to show up per spv. I want the BF to show up per SPV. And I want the CAP to show up per BF.

Sorry for the rushed image. I hope you get what I'm saying.

Thanks so much for your help.
Re: Table grouping help [message #765777 is a reply to message #765417] Wed, 14 December 2011 16:56 Go to previous message
Jason Weathersby is currently offline Jason WeathersbyFriend
Messages: 9167
Registered: July 2009
Senior Member

I can not get this output with grouping. It can probably be done with
scripting if you know what the logic is for a specific column. For
example only display it if is different than the previous value and the
column before it has not changed?

Jason

On 12/13/2011 9:17 PM, redviper8 wrote:
> Thank you for showing me how to do this! I've never used .csv before.
>
> I've attached an updating .zip with an updated .csv that will show the problems I have with this report when ran.
>
> Also, here is a screenshot with the problem areas outlined.
> http://i274.photobucket.com/albums/jj265/Erebel55/screenshot-6.png
>
> So basically I want the phase to show up per spv. I want the BF to show up per SPV. And I want the CAP to show up per BF.
>
> Sorry for the rushed image. I hope you get what I'm saying.
>
> Thanks so much for your help.
Previous Topic:Dynamic Report; No Values Appear
Next Topic:Creating html5 report rendering extension
Goto Forum:


Current Time: Thu Apr 18 15:42:17 GMT 2024

Powered by FUDForum. Page generated in 0.02236 seconds
.:: Contact :: Home ::.

Powered by: FUDforum 3.0.2.
Copyright ©2001-2010 FUDforum Bulletin Board Software

Back to the top