|
| Re: Build an gantt chart: grouping data on Y-axis [message #730100 is a reply to message #729886] |
Tue, 27 September 2011 15:49   |
|
Val,
What do you want to do with the area b? I am not sure what you want the
resultant chart to look like.
Jason
On 9/27/2011 4:18 AM, val.dupin wrote:
> Helo,
> I have a question about the structure of an XML file to build a Gantt
> chart.
>
> I use an XML file containing:
>
> <booking>
> <reserves startDate="24/8/2011" endDate="9/8/2011" id="1">
> <owns name="Titi" address="Street one"/>
> <concerns>
> <area>B</area>
> <capability>4</capability>
> <name>Red house</name>
> <roomCount>2</roomCount>
> </concerns>
> </reserves>
> <reserves startDate="21/9/2011" endDate="28/9/2011" id="2">
> <owns name="Toto" address="Street two"/>
> <concerns>
> <area>A</area>
> <capability>4</capability>
> <name>Blue house</name>
> <roomCount>5</roomCount>
> </concerns>
> </reserves>
> <reserves startDate="10/9/2011" endDate="11/9/2011" id="3">
> <owns name="Tutu" address="Street three"/>
> <concerns>
> <area>A</area>
> <capability>4</capability>
> <name>Blue house</name>
> <roomCount>5</roomCount>
> </concerns>
> </reserves>
> </booking>
>
>
> I would like to create a gantt chart with date in x-axis and area (A,B)
> in Y-axis.
>
> In the "edit dataset" window in Birt, what Row mapping must I choose ?
> /booking/reserves/concerns ?
> /booking/reserves/concerns/area ?
> /booking/reserves ?
>
> Whatever path, I always have 2 rows for A area and 1 row for B area in
> the preview result in the Edit dataset window and in my gantt chart I
> have 2 A and 1 B in y-axis.
>
> I would like to group booking by area in order to have 1 phase for Toto
> and one phase for Tutu for the A area. Is it possible or must I change
> the XML file structure ?
>
> Thanks in advance.
>
> Val
|
|
|
| Re: Build an gantt chart: grouping data on Y-axis [message #730368 is a reply to message #730100] |
Wed, 28 September 2011 09:09 |
 Missing name Missing name Missing name Missing name
Messages: 57
Registered: September 2009 |
Member |
|
|
Hello Jason,
Thanks for our reply.
I would like to create a gantt chart to display each booking for each area.
So in the x-axis, there will be placed dates, and in the y-axis, I would like to have area.
Each task represents a reservation( from startdate to enddate).
See the attachment:
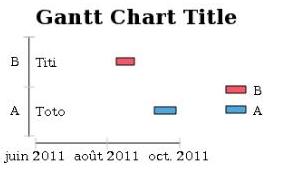
In this image, I only have one task (booking) for each area.
Changing Toto and Tutu start and end dates (on A area), I realised that Tutu booking and Toto booking using A area are glued. The chart considers that the task is from Tutu booking startdate to Toto booking enddate. Why ?
I attach the rptdesign and xml data files too, that create this gantt chart.
Thanks in advance.
Val.
 Attachment: gantt.jpeg
(Size: 6.92KB, Downloaded 1242 times) Attachment: report.rptdesign
(Size: 49.58KB, Downloaded 427 times)-
Attachment: booking.xml
(Size: 0.79KB, Downloaded 187 times)
[Updated on: Wed, 28 September 2011 09:20] Report message to a moderator |
|
|
|
| Re: Build an gantt chart: grouping data on Y-axis [message #730537 is a reply to message #730368] |
Wed, 28 September 2011 15:14 |
|
Val,
Take a look at the attached example that uses your data. Notice I added
two computed columns for the dates.
Jason
On 9/28/2011 5:09 AM, val.dupin wrote:
> Hello Jason,
>
> Thanks for our reply.
> I would like to create a gantt chart to display each booking for each area.
> So in the x-axis, there will be placed dates, and in the y-axis, I would like to have area.
> Each task represents a reservation( from startdate to enddate).
>
> See the attachment:
>
>
>
> In this image, I only have one task (booking) for each area. Tutu booking doesn't appear. Why ?
>
> I attach the rptdesign and xml data files too, that create this gantt chart.
>
> Thanks in advance.
>
> Val.
 Attachment: gantt.zip
(Size: 5.13KB, Downloaded 265 times)
|
|
|
Powered by
FUDForum. Page generated in 0.01953 seconds
") ]
]  Search
 Help
Help Register
 Login
Login Home
Home


