

Eclipse Community Forums
Forum Search:

Search      Help    Register    Login    Home
Home » Eclipse Projects » Nebula » XYGraph - suggested way for user interaction(Draw a square on top of the XYGraph and react to user actions. What is the suggested way to achieve this?)
XYGraph - suggested way for user interaction [message #1708458] Wed, 16 September 2015 18:01 Go to next message
Patrik Suzzi is currently offline Patrik SuzziFriend
Messages: 2
Registered: February 2018
Junior Member
Hallo,

I created an RCP application with a Nebula XYGraph chart, and now I am adding clickable squares.

The idea is to add a clickable square centered on a data point, and to react to user clicks by executing arbitrary code.

index.php/fa/23288/0/

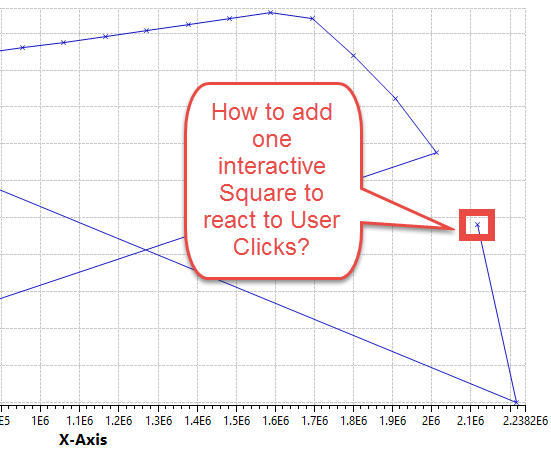
For now I draw few squares. Each one is a RectangleFigure, added on top of the XYGraph figure, and each one has an attached Mouse listener.

RectangleFigure nodeRect = new RectangleFigure();
nodeRect.setForegroundColor(COLOR_RED);
nodeRect.setBackgroundColor(COLOR_YELLOW);
for(int i=0; i<3; i++){
	int xVal = 100*(1+i);
	int yVal = 100*(1+i);
	nodeRect.setBounds(new Rectangle(xVal, yVal, 30, 30));
	xyGraph.add(nodeRect);
	// listener prints the click
	nodeRect.addMouseListener( myMouseClickListener );
}


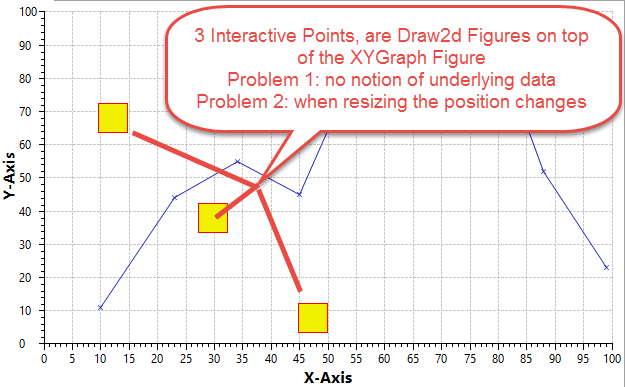
In this case, the clickable squares (Draw2D Figure) are on a layer external to XYGraph, and this brings two issues:

  • The clickable squares are not linked to data points in the XYGraph chart, so I will have to "rescale" their x and y relatively to the graph. I don't know how to scale data from XYGraph space to Draw2d space.
  • When resizing the XYGraph container, my squares are cut off, and I have to explicitly move them. So I think I need to intercept the XYGraph resize event. I don't know how to intercept the XYGraph resize events.


index.php/fa/23289/0/

I already checked the XYGraph source code and examples. But I found no examples on this, and I found a little bit difficult to interact with XYGraph.
( I tried using annotations, but the mouse events are intercepted and canceled by the XYGraph listening system)

So, I would like to know if someone could point me to some example / best practices on how to add and interactive layer on XYGraph.

Any advice or suggestion it would be extremely useful.

Kind Regards

[Updated on: Thu, 17 September 2015 10:07] by Moderator

Report message to a moderator

Re: XYGraph - suggested way for user interaction [message #1708802 is a reply to message #1708458] Mon, 21 September 2015 11:24 Go to previous messageGo to next message
Wim Jongman is currently offline Wim JongmanFriend
Messages: 493
Registered: July 2009
Senior Member

Hi Patrik,

We are able to add annotations to points and Annotation contains a listener. Can't you do something with that?

Cheers,

Wim
Re: XYGraph - suggested way for user interaction [message #1708805 is a reply to message #1708802] Mon, 21 September 2015 11:48 Go to previous messageGo to next message
Patrik Suzzi is currently offline Patrik SuzziFriend
Messages: 2
Registered: February 2018
Junior Member
Wim,

Thank you very much for the response.

I found the behavior of annotations was limiting. In particular I think annotations are linked to a specific trace or axis, then they can not listen on "arbitrary areas of the chart".

So I decided to go with a specialized solution: Adding figures on top of the XYGraph.

With this solution I can add RectangleFigures on arbitrary areas of the Chart, and I can listen to the mouse events.
The only drawbacks are:
- I had to implement myself a scaling/conversion mechanism from data points to pixel space.
- I am reacting to XYGraph#postLayout() to redraw the interactive points each time the Canvas area is resized.
- my system is not working when zooming on the chart.

I think it would be interesting adding this kind of mechanism to XYGraph, but taking into account also the chart zooming.

Met vriendelijk groet.
Re: XYGraph - suggested way for user interaction [message #1708809 is a reply to message #1708805] Mon, 21 September 2015 12:07 Go to previous message
Wim Jongman is currently offline Wim JongmanFriend
Messages: 493
Registered: July 2009
Senior Member

Hi Patrik,

I know that this kind of solution is already implemented. You might be striking against the grain. Maybe you want to ask your question again on the Science mailing list [1].

[1] https://science.eclipse.org/

Cheers,

Wim
Previous Topic:Nebula PShelf Extension for Jubula
Next Topic:XYGraph - how to draw data points with no connecting line?
Goto Forum:


Current Time: Tue Apr 16 16:29:51 GMT 2024

Powered by FUDForum. Page generated in 0.45125 seconds
.:: Contact :: Home ::.

Powered by: FUDforum 3.0.2.
Copyright ©2001-2010 FUDforum Bulletin Board Software

Back to the top