![]()
To debug a PHP Web Page:
Click the arrow next to the debug button
 on the toolbar and select Open Debug Dialog -or- select Run
| Open Debug Dialog.
on the toolbar and select Open Debug Dialog -or- select Run
| Open Debug Dialog.
A Debug dialog will open.Double-click the PHP Web Page option to create a new debug configuration.
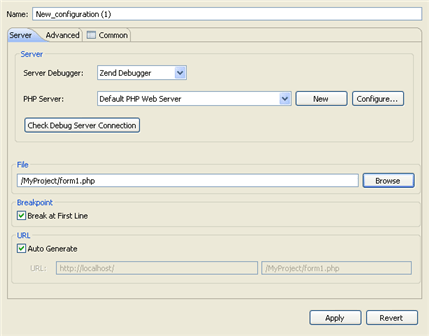
Enter a name for the new configuration.
Select the Server Debugger to be used . PDT supports both the Zend Debugger and XDebug.
Select your server from the PHP Server list.
If you have not yet configured your server, click New.
The PHP Server Creation Wizard will open.
Configure your server by following the instructions on 'adding a new server' under the PHP Servers Preferences page.To check whether your server connection is correctly configured, and that PDT can communicate with your server debugger, click the 'Check Debug Server Connection' button.
Under PHP File, click Browse and select your 'debug target' file (the file from which the debugging process will start.)
Select whether the Debugger should stop at the first line of code by marking/unmarking the 'Break at First Line' checkbox.
The URL to be debugged will have been automatically created based on the file name and your server address. If the URL does not point to your debug target's location, unmark the Auto Generate checkbox and modify the URL.
For further Debug options, select the Advanced tab, which has the following options:
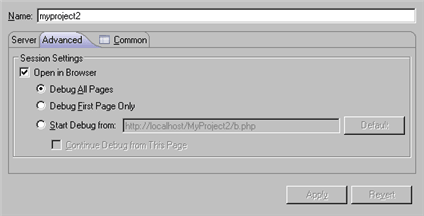
Open in Browser - Mark if you would like the application to be displayed in PDT 's internal browser while it is debugged.
Choose whether to:
Debug All Pages - The specified page and all the pages linked to it are debugged. The browser waits for the debug of each page before displaying it.
Debug First Page Only - Only the first page is debugged.
Start Debug from - Select the URL from which you would like the Debugging process to start.
Continue Debug from this Page - Selecting this option will result in all the pages linked to the URL being debugged.
Click Apply and then Debug.
Click Yes if asked whether to open the PHP Debug Perspective.
See the "Running and Analyzing Debugger results" topic for more information on the outcome of a debugging process.