| Release | Resolved | Community Contributions |
| 2.1 27 Sept 2013 |
38 bugs | Minor release containing OPerf support, SystemTap editor upgrades, LTTng upgrades, in addition to bug fixes. |
New in Linux Tools 2.1
- API Documentation Hover Help (1)
- LTTng (7)
- OProfile Profiling (1)
- Perf Profiling (1)
- RPM Stubby (4)
- RPM .spec Editor (4)
- Systemtap Editor (1)
API Documentation Hover Help
|
Devhelp regeneration on start-up |
The Libhover Devhelp support has been enhanced so that the devhelp documentation is parsed upon start-up of Eclipse. This enables devhelp selections immediately instead of waiting until the end-user manually schedules a regeneration of the documentation in Libhover binary format. |
|
|
|
Linux Tracing Toolkit
|
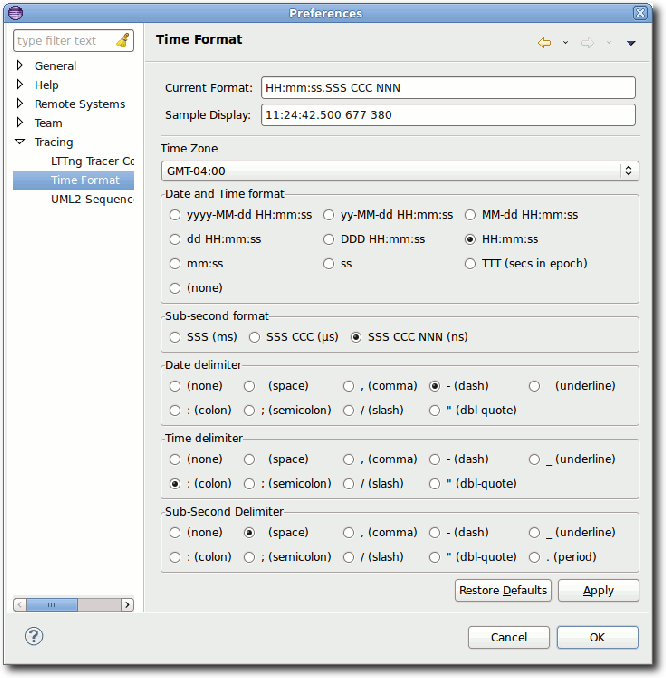
Configurable Time Zone Preference |
The time zone preference has been added to the time format preference page.
|
|
|
|
|
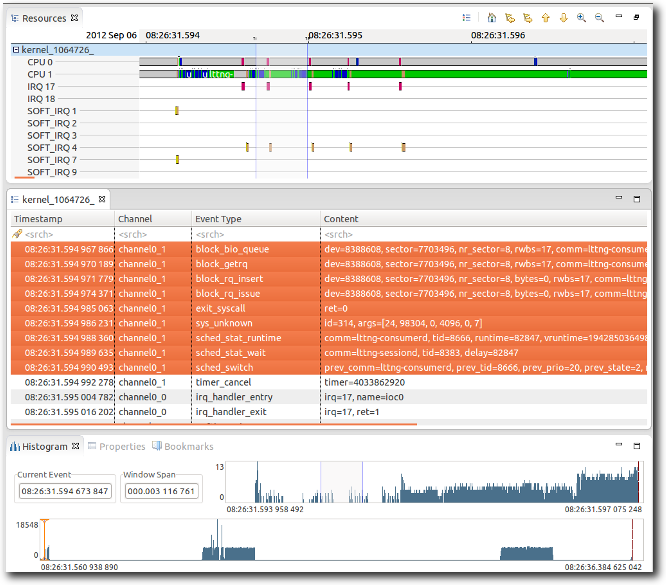
Support for Time Range Selection in Tracing Views |
It is now possible to select a time range in the
tracing views instead of selecting just a single time. This
information is broadcasted using the time synchronization signal
so that relevant views update their selection. Also the selected
start time, end time and time delta is displayed in the status
line of the worbench. The time range selection is added
in the Control Flow view, Resources view and Histogram view.
The Events table also allows the selection of an event range.
The Statistics view now displays the number of events for
the selected time range.
|
|
|
|
|
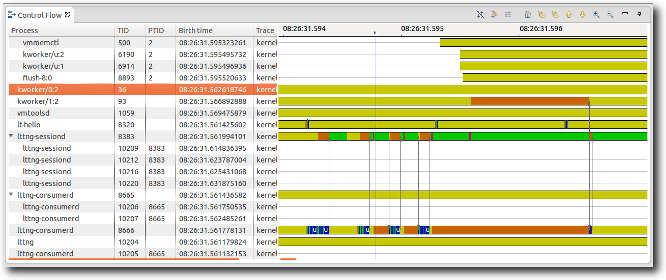
Display of Execution Flow in Control Flow View |
The Control Flow view now provides arrows to follow the
switching of CPU execution across processes. The arrows can be
followed in forward and backward direction by using the corresponding
buttons of the coolbar. The display of the arrow disabled by using the
Hide button of that view.
|
|
|
|
|
Support for LTTng Tools v2.2 |
The Control view now supports version v2.2 of LTTng Tools. It is now possible to configure
Refer to the User Guide for detailed information on the LTTng Tracer Control and its usage. 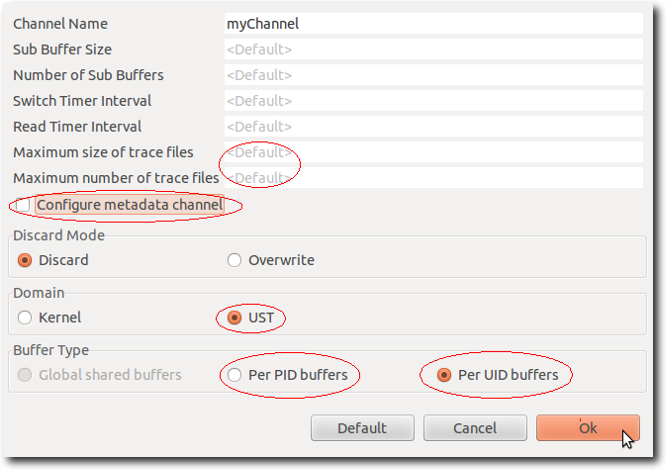
|
|
|
|
|
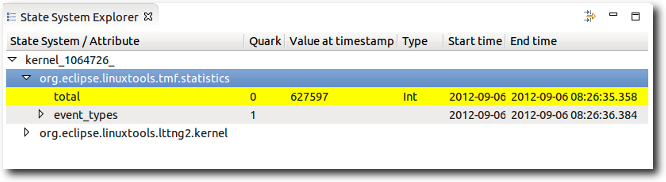
Highlight of Attribute Changes in State System Explorer |
The State System Explorer now hightlights the
changes of states when changing the current time selection.
|
|
|
|
|
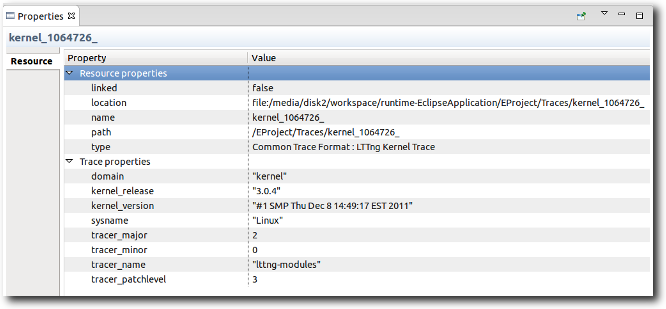
Display of Trace Properties in the Properties view |
The Eclipse's Properties view now shows also
additional trace properties such as CTF environment variables.
|
|
|
|
|
Improved GUI Responsiveness |
The GUI reponsiveness has been improved when processing multiple concurrent request while indexing a trace. The updated request scheduler now ensures that each concurrent request gets sufficient execution time and doesn't have to wait for other requests of the same or higher priority to finish. |
|
|
|
|
Framework Improvements |
|
OProfile Profiling
|
OPerf Support |
The OProfile plug-in has been enhanced to allow the end-user to use the new OPerf support added to OProfile. OPerf allows the end-user to profile without requiring root access. This eliminates the need for running a pre-installation script before running OProfile. 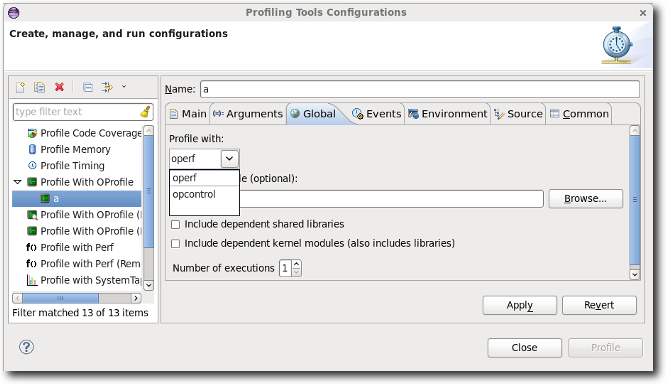
|
|
|
|
Perf Profiling
|
Stat Diff View Improvements |
The Stat Diff View shows the differences between two perf-stat reports in a view. In addition it is now possible to view the individual reports used to form the diff from the view by selecting the 'Show Old Statistics' or 'Show New Statistics' buttons. 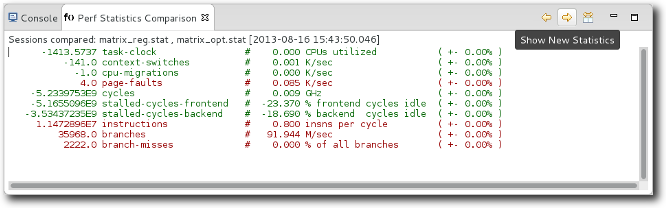
|
|
|
|
RPM Stubby
|
RPMStubby Menu |
The menu has been modified to allow the use of RPMStubby to stub out and make a .spec file out of Perl makefiles, Ruby gems, and Python eggs. 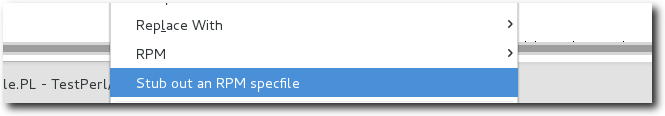
|
|
|
|
|
Generate Perl .spec file stub |
Perl makefiles contain a lot of information that could be used to package them as an RPM. The Perl stubby generator does exactly that by generating a stubbed out .spec file template from the .PL file. More information on the guidelines for this procedure can be viewed at Perl Packaging Guidelines. 
|
|
|
|
|
Generate Ruby .spec file stub |
Ruby gems contain a lot of information that could be used to package them as an RPM. The Ruby stubby generator does exactly that by generating a stubbed out .spec file template from the .gemspec file. More information on the guidelines for this procedure can be viewed at Ruby Packaging Guidelines. 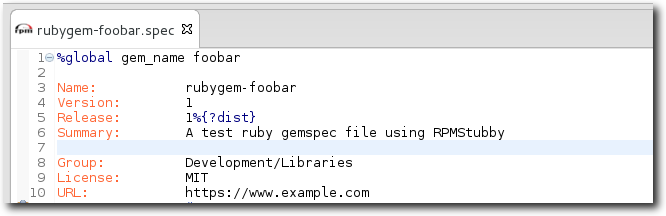
|
|
|
|
|
Generate Python .spec file stub |
Python eggs contain a lot of information that could be used to package them as an RPM. The Python stubby generator does exactly that by generating a stubbed out .spec file template from the setup.py file. More information on the guidelines for this procedure can be viewed at Python Packaging Guidelines. 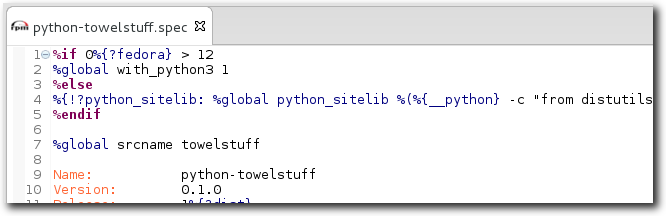
|
|
|
|
RPM .spec Editor
|
RPM Menu |
The menu has been modified to allow convenient access to the Download Sources and Prepare Sources functionality on the .spec file. 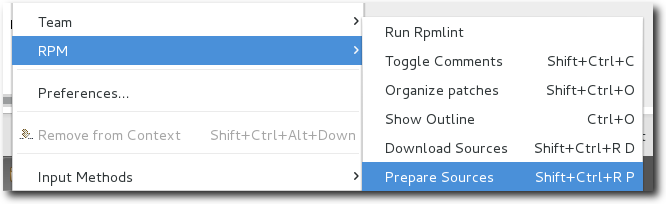
|
|
|
|
|
Download sources for a .spec file |
The RPM .spec editor now supports being able to download the sources for the .spec file. Downloading sources will attempt to download from the source urls within the .spec file. If the sources already exist within the current project, then Download Sources will automatically overwrite the existing sources. 
|
|
|
|
|
Prepare sources for a .spec file |
The RPM .spec editor now supports being able to prepare the sources for the .spec file. Preparing sources will attempt to download the source files before it executes the %prep section. Refer to Maximum RPM - Executing %prep 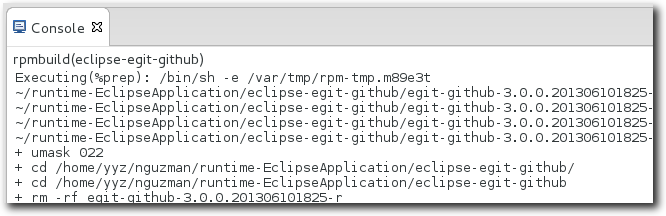
|
|
|
|
|
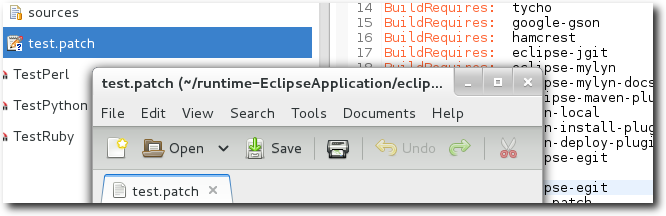
Create patches that do not exist |
RPM now supports creation of patch files by holding Ctrl then hovering and left clicking on a patch file that does not exist within the project that the specfile belongs to. The newly created file also follows the RPM Project layout and will place it accordingly The default editor for the file will open immediately after successful creation of the patch file. 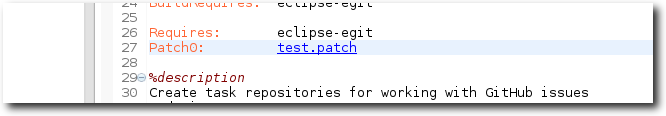
|
|
|
|
Systemtap Integration
|
Enhanced SystemTap Editor Formatting |
The SystemTap editor has been enhanced with regards to formatting. Auto indent capability has been added for new lines and the editor supports indent correction of either a single line or selected lines via the Ctrl+I short-cut. Comments can be added/removed via CTRL+/. In addition, the editor has been improved with regards to auto-completed characters to match the behaviour of existing editors such as the C/C++ editor. For example, if the user starts a string via a double-quote, the editor automatically adds the closing double-quote for the end-user and recognizes when the user unnecessarily types the closing double-quote again. 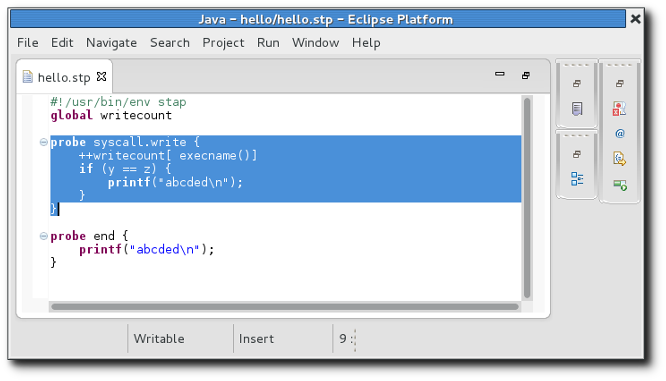
|
|
|
|