| Release | Resolved | Community Contributions |
| 0.9.2 16 Feb 2012 |
3 bugs | This was a minor bug-fix-only release that fixed a few minor bugs and added p2 data to handle the rename of certain features during the Indigo release cycle. |
| 0.9.1 20 Jan 2012 |
4 bugs | This was a minor bug-fix-only release that included p2.inf files for all features and moved the dataviewer classes into a separate feature from the profiling common feature. |
| 0.9 2 Nov 2011 |
58 bugs | [LTTng] Thanks to Patrick Tasse who contributed most of the new trace streaming functionality, Mathieu Denis who worked on making the Statistics View more generic and Daniel Thibault who contributed by testing, commenting and providing patches. [RPM]Minoo Ziaei enhanced rpm stubby and editor while Andrew Robinson worked on command running methods. [SystemTap]Thanks to Otavio Pontes who contributed on the launch configuration attributes, graph wizard management and went gif hunting in his spare time. [Valgrind]Martin Oberhuber made target Valgrind version configurable and Rafael Medeiros Teixara made an empty view a little less lonely. |
New in Linux Tools 0.9
Linux Tracing Toolkit
|
UML2 Sequence Diagram Framework |
A new framework to generate UML2 Sequence Diagrams from traces. It provides:

|
|
|
|
|
CNF Integration |
The LTTng Project View is deprecated and its functionality integrates now directly in the Eclipse Project Explorer using CNF (Common Navigator Framework). The feature provides:
Refer to the User Guide for detailed information. 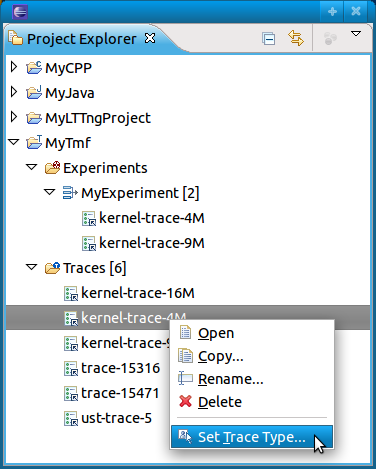
|
|
|
|
|
LTTng Trace Streaming |
This feature allows to connect to an LTTng instrumented node and to live stream the trace as it is generated. The various LTTng/TMF views were adapted to seamlessly integrate trace streaming. Refer to the User Guide for detailed information. |
|
|
|
|
Enhanced Statistics View |
The Statistics View was de-coupled from the LTTng kernel trace structure and made more generic so it can be used for any type of trace. Refer to the User Guide for detailed information. 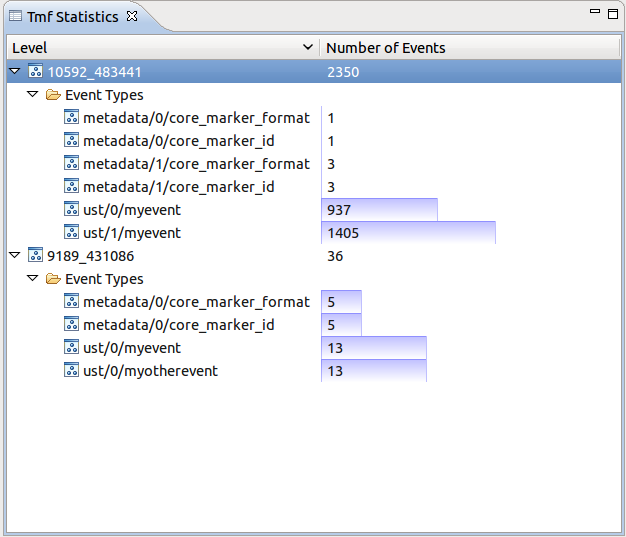
|
|
|
|
|
Enhanced Histogram View |
The Histogram View displays the event distribution over time for the whole trace as well as for the selected, zoomed, event window of interest. It was enhanced to provide:
Refer to the User Guide for detailed information. 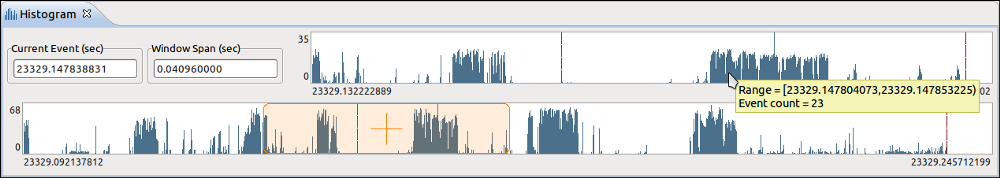
|
|
|
|
Man Page
|
Cygwin/Windows fixes |
Fixes for properly working with Cygwin man. |
|
|
|
RPM Stubby
|
Generate better spec files |
|
|
|
|
|
Initial API |
Initial API has been exposed drived by the demands of Eclipse Fedorapackager plugin. |
|
|
|
RPM .spec Editor
|
BuildRequires template |
BuildRequires template has been added for better autocompletion |
|
|
|
|
Quick outline |
Quick outline has been enhanced to auto select subpackages |
|
|
|
|
Multi Layout projects |
RPM projects allow choosing between RPMBUILD (SPECS,SOURCES,RPMS subfolders) and FLAT (all files in same folder) project layouts. This is supported on both new project creation and srpm import. |
|
|
|
|
Unit tests |
Unit tests have been updated to use JUnit 4 for faster execution time. |
|
|
|
|
Cancellable long running tasks |
Thanks to Andrew Robinson work long running tasks(build, rpm/yum queries) can be canceled. |
|
|
|
Valgrind Profiling
|
New Valgrind Error Markers |
The error markers for Valgrind have been changed so they are distinct from compilation errors. The markers show up in the C/C++ editor as well as the Valgrind view. Markers in the problem's view still show as standard errors as this cannot be currently customized. In addition, it is now possible to clear all Valgrind error markers from the Valgrind view. 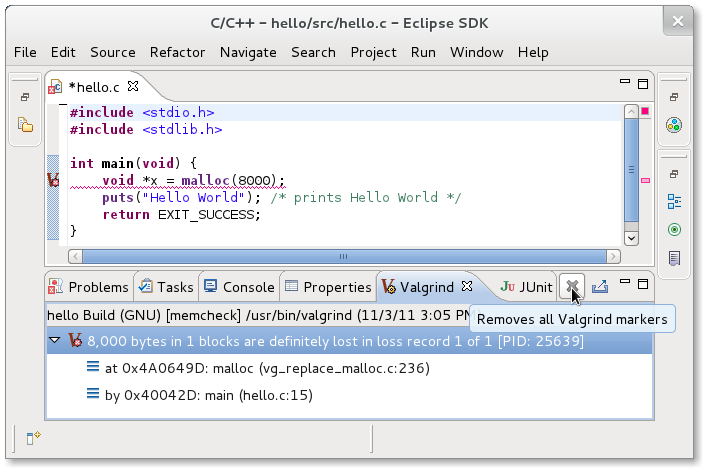
|
|
|
|