Algorithm Debugging
The Eclipse Layout Kernel provides debugging support through its debugging infrastructure, which consists of three layers:
-
Logging mechanisms that algorithm developers can use to generate log messages as well as log snapshots of graphs as they are laid out. The messages can optionally be written to disk.
-
Viewers that algorithm developers can use to inspect all kinds of logged objects as well as the execution times of their algorithms.
-
Preferences that algorithm developers and users can use to engage or disengage the production of logs.
Logging Mechanisms
Layout algorithms extend the AbstractLayoutProvider class and thus implement the following method:
public void layout(ElkNode layoutGraph, IElkProgressMonitor monitor) {
    ...
}
The key entry point to everything concerning logging is the IElkProgressMonitor. Here’s how to use it:
public void layout(ElkNode layoutGraph, IElkProgressMonitor monitor) {
    monitor.begin("TestAlgorithm", 2);

    monitor.log("Algorithm starting...");

    // As with assertions, lengthy computations should only be done if logging
    // is in fact enabled
    if (monitor.isLoggingEnabled()) {
        // Perform some lengthy computation
        monitor.log("Found...");
    }

    // You can log snapshots of the layout graph
    monitor.logGraph(layoutGraph, "No node placed yet");
    placeNodes(layoutGraph);
    monitor.logGraph(layoutGraph, "All nodes placed");

    progressMonitor.done();
}
When logging graphs, each graph is supplied with a tag: a string that allows a developer to make sense of the graph in the logs later on. There are two ways to log graphs:
-
logGraph(ElkNode graph, String tag)This method copies the supplied ELK graph and stores it with the given tag.
-
logGraph(Object graph, String tag, LoggedGraph.Type graphType)This method stores the given object without copying it. We support several graph types, and the type of the
graphobject must match thegraphType:Graph type Description Object type DOTA GraphViz Dot graph. StringELKAn ELK graph. ElkNodeJSONA graph in ELK’s JSON format. StringSVGAn SVG file. String
When running inside Eclipse, ELK automatically logs the input and output graphs so you don’t have to.
Log Persistence
If log persistence is turned on, everything that is logged is written to disk. It will end up in a folder called elk in the current user’s home directory. Each layout run’s logs will be placed in a separate sub-directory whose content reflects the progress monitor hierarchy.
Log Viewers
ELK provides three views to inspect layout runs: the Layout Time View, Layout Log View, and Layout Graph View. They have a rather similar look to them: all feature a tree viewer of layout runs at the left side. In fact, they all display the same layout runs: if one is removed, it is removed from all three views. Open any of the views by clicking Window -> Show View -> Other and looking for them in the Eclipse Diagram Layout category.
Let’s examine the views in turn.
Layout Time View
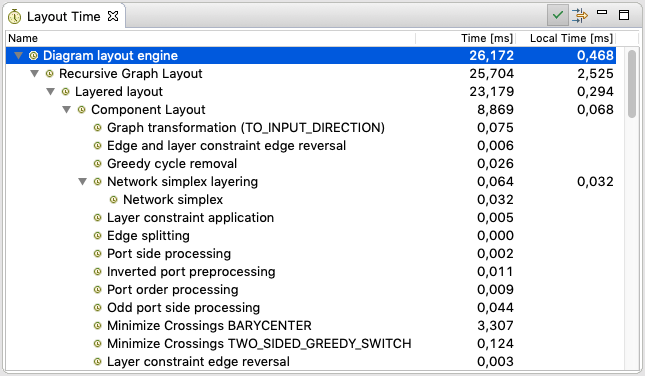
The Layout Time View displays the amount of time spent in each progress monitor of a layout run’s progress monitor hierarchy. It displays two values for each item: the time and the local time. The former is the amount of time spent in a progress monitor including its sub-monitors. The local time is the time spent in the progress monitor alone, excluding any sub-monitors (this value is omitted for monitors that do not have any sub-monitors, since it would be equal to the normal time value anyway).
The view offers the following functions:
-
Execution time measurement can be directly switched on and off by clicking the check mark instead of going to the preferences.
-
All layout runs that don’t have execution time information associated with them can be hidden by clicking the filter button.
To take proper advantage of the layout time view, your algorithm must make proper use of the IElkProgressMonitor passed to it. The tree of progress monitors (and sub-monitors) is what gets displayed in the layout time view. Be sure to do something like this:
monitor.begin("My rather good layout algorithm", 2);

// Phases of your algorithm should use sub-monitors
executePhase1(monitor.subTask(1));
executePhase2(monitor.subTask(1));

monitor.done();
Layout Log View
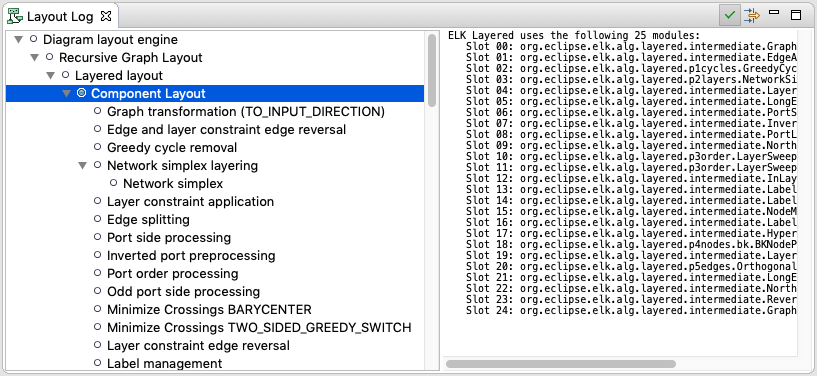
The Layout Log View displays all log messages submitted by calls to IElkProgressMonitor.log(Object). Each such log message is associated with the progress monitor it was logged with. Whether a progress monitor has log messages associated with it is indicated by its icon: a blue icon indicates the presence of log messages.
The view offers the following functions:
-
Logging can be directly switched on and off by clicking the check mark instead of going to the preferences.
-
Clicking the filter button hides all progress monitors that are not on a path to progress monitors with log messages and don’t have log messages themselves.
Layout Graph View

The Layout Graph View displays all logged graphs submitted by calls to one of the IElkProgressMonitor.logGraph(...) methods. Each such graph is associated with the progress monitor it was logged with. Whether a progress monitor has graphs associated with it is indicated by its icon: a blue icon indicates the presence of graphs. The list right next to the tree of progress monitors allows to switch between the graphs.
The way a graph is displayed depends on its format. ELK graphs are drawn in a very simple way. For all other formats, we currently only show their source code.
If you have nothing better to do…
It would be cool to be able to properly display the other formats as well, so if you’re still looking for that good deed today: here it is!
The view offers the following functions:
-
Logging can be directly switched on and off by clicking the check mark instead of going to the preferences.
-
Clicking the filter button hides all progress monitors that are not on a path to progress monitors with log messages and don’t have log messages themselves.
-
The view can import and display
elktandelkgfiles, either directly or after having laid out the graph first (use the overflow menu to configure this). A graph loaded from file can also be reloaded explicitly in case the file has changed. -
Images shown in this view can be saved as
pngfiles.
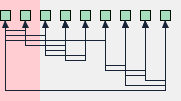
Notes on Graph Drawings
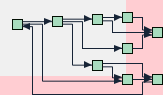
ELK graphs are drawn using their exact coordinates and sizes so developers can debug the exact results produced by their algorithms. The background colors deserve being elaborated upon.
The area from coordinate (0, 0) to (width - 1, height - 1) is drawn with a slightly green background color. Everything that falls outside this area is marked with a red background colour. Examples:
-
The two leftmost nodes have negative x coordinates.
-
The uppermost node has a negative y coordinate.
-
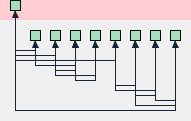
The graph is too small to hold all of its nodes.
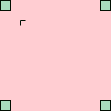
-
If there is no green area, but there are nodes with negative coordinates, it can be impossible to spot the coordinate system’s origin. Helpful as we are, we draw an indicator in these situations:
Functionality Common to All Views
Each of the three views offers a context menu for the progress monitor tree:
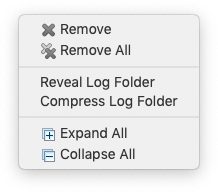
The menu provides access to the following functions:
-
Remove the selected or all items. This will affect all debug views, not just the one the context menu was opened in.
-
If a progress monitor’s logs were persisted, they will end up in some directory on the file system. Reveal Log Folder will open that directory for further inspection. Compress Log Folder will compress that folder’s content and save it as a
ziparchive. The latter item is only available on top-level entries. -
Expand or collapse the whole tree.
Log Configuration
When running in Eclipse, the preferences contain a page with logging options:
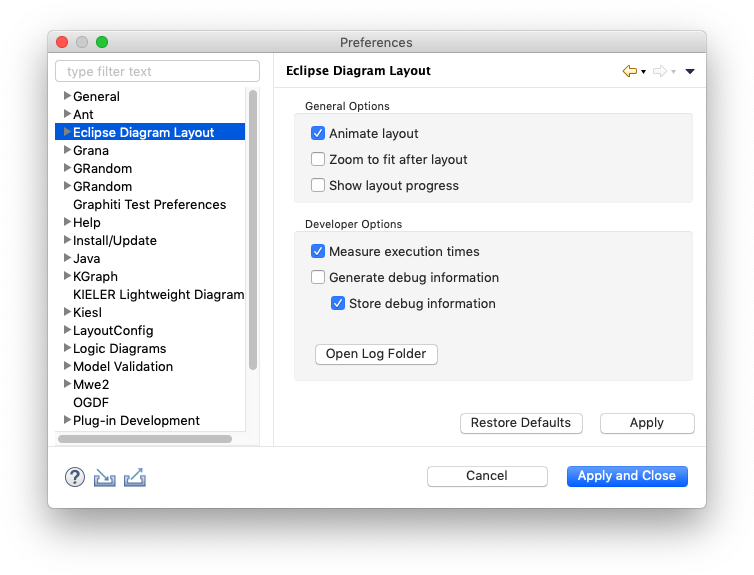
-
Measure execution times
If enabled, progress monitors measure execution times and thus supply the Layout Time View with something interesting to display.
-
Generate debug information
If enabled, the log methods on
IElkProgressMonitoractually record logs instead of not doing anything. Also, the return value ofisLoggingEnabled()is influenced by this option. -
Store debug information
If enabled, log messages are not simply recorded to be displayed in the user interface, but are also written to disk. The folder they’ll end up in can be opened by pressing the Open Log Folder button.
If automatic layout is not used from inside Eclipse, the progress monitors must be configured manually before being passed to the graph layout engine or directly to the layout algorithm:
new BasicProgressMonitor()
    .withLogging(true)
    .withLogPersistence(false)
    .withExecutionTimeMeasurement(false);